Overview
Account administrators and Sales Managers have access to two pages related to usage reporting.
- Reports - is a table of usage counts for all users in your company
- Scheduled Reports - provides the option to have a daily or weekly usage report to your email.
Usage Report
 Let's get Oriented
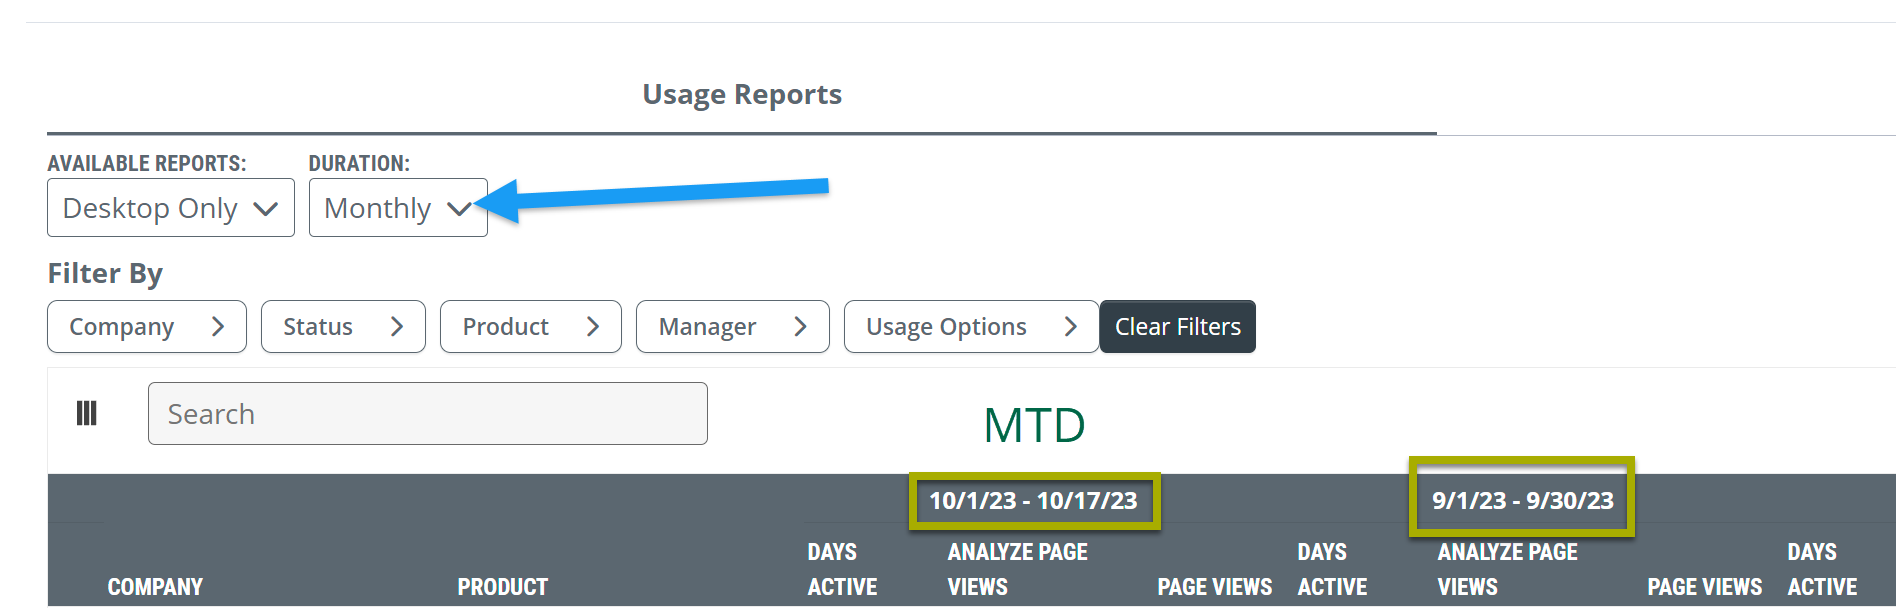
As an account administrator or a sales manager, it is helpful to know if and when your team is using Trella Insights. The image below summarizes the main elements to the page.
![]() Click on the image to enlarge it.
Click on the image to enlarge it.
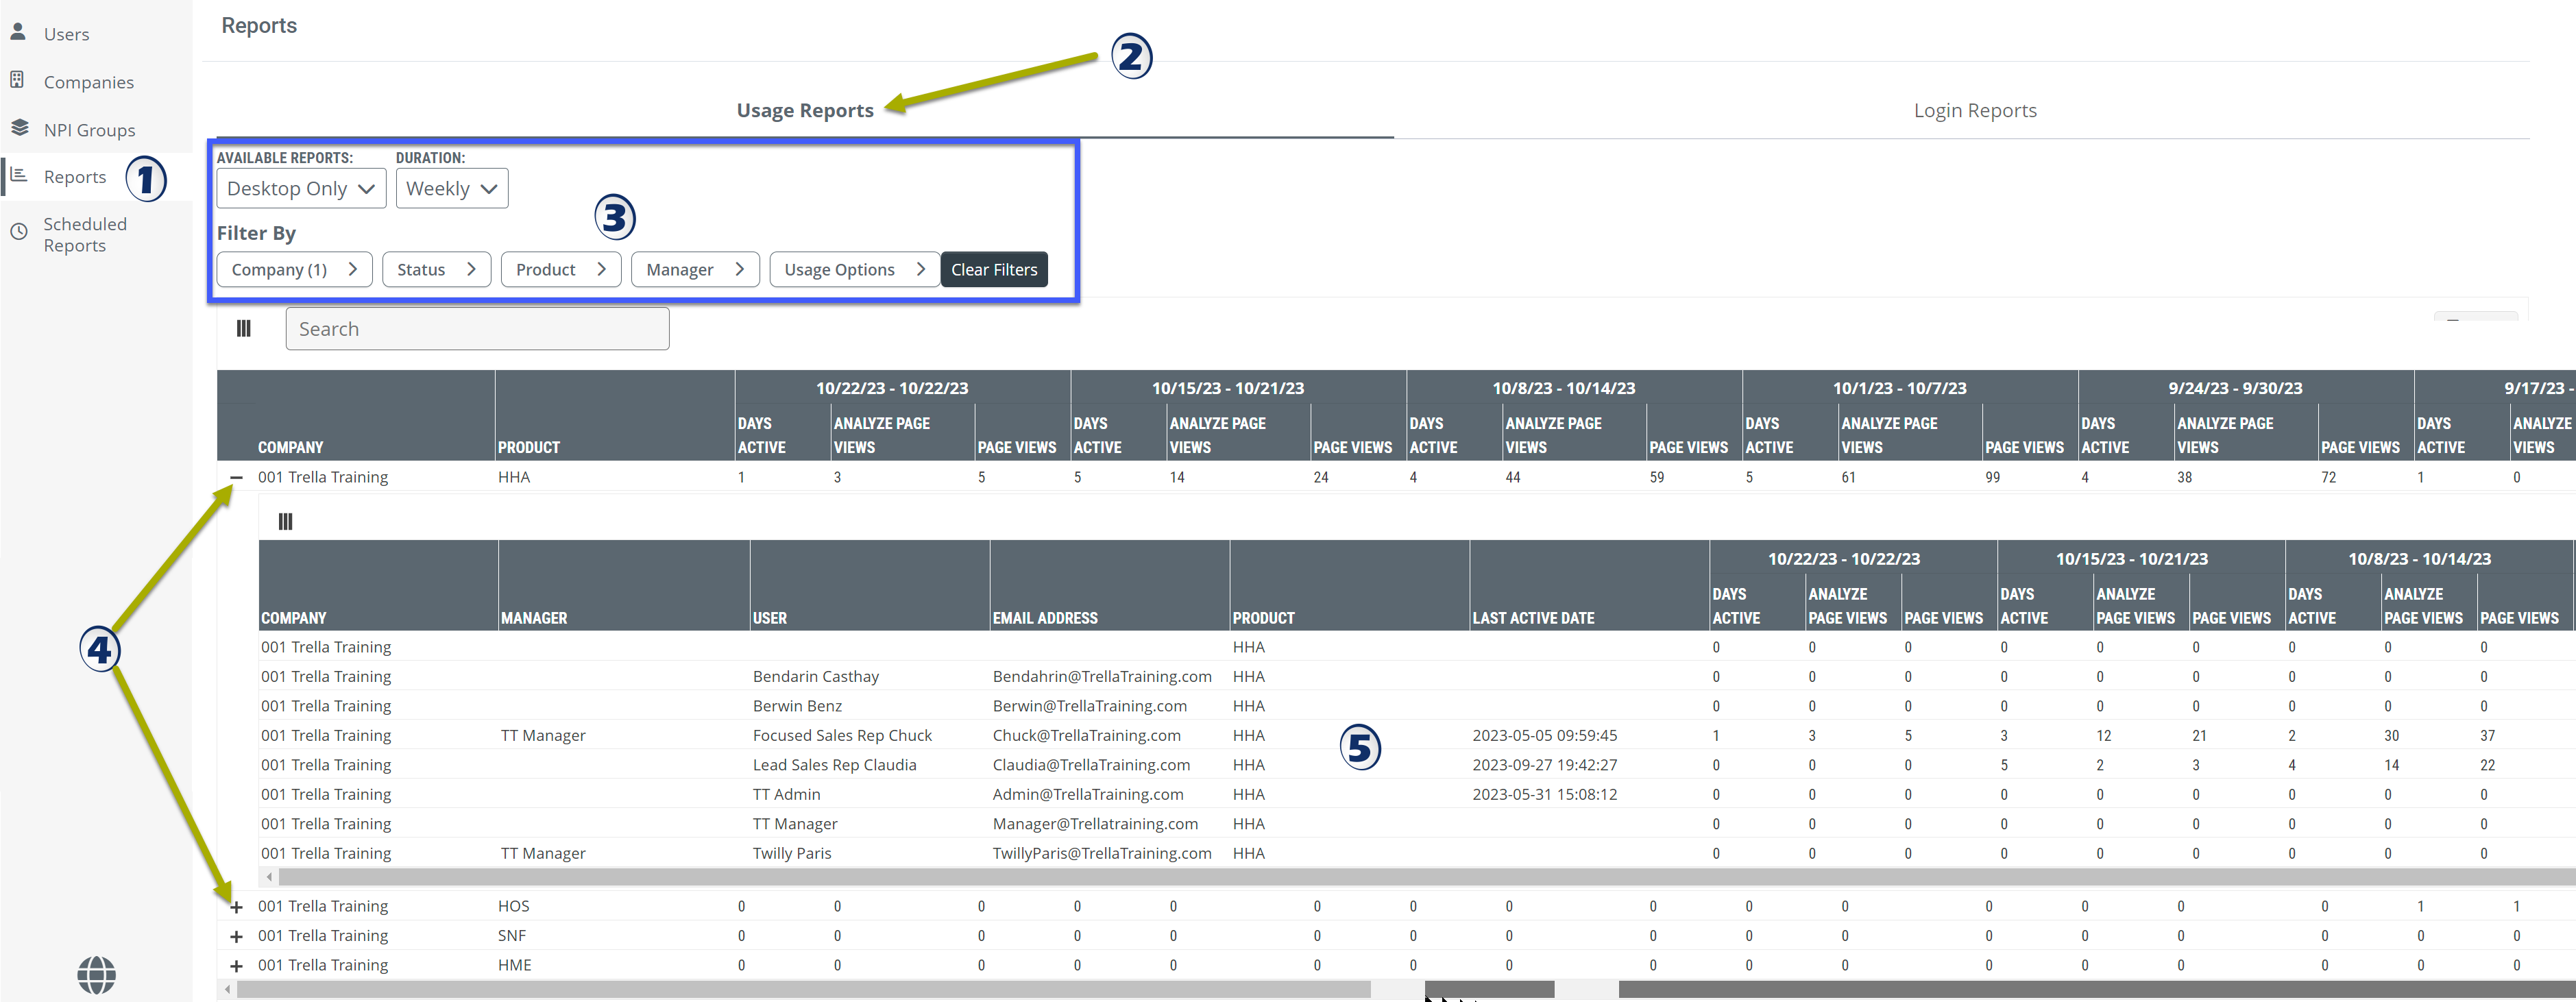
![]() To view the report, log in to the Admin tools and click on the "Reports" button in the left navigation
To view the report, log in to the Admin tools and click on the "Reports" button in the left navigation
![]() Click on the "Usage Reports" Tab.
Click on the "Usage Reports" Tab.
![]() This is the default, so you might not need to click anything.
This is the default, so you might not need to click anything.
![]() Format and Filters
Format and Filters
You have some choices:
- The format of the content in the table - how your user's metrics will display.
- There are multiple filters available to limit the entries in the table.
Multiple dropdown lists allow you to make changes to the content in the table.
![]() If you don't choose any options in the "Filter by" section, all entries will be displayed in the table. For any specific filter, if you do not choose any options, you will see all entries for that filter option in the table.
If you don't choose any options in the "Filter by" section, all entries will be displayed in the table. For any specific filter, if you do not choose any options, you will see all entries for that filter option in the table.
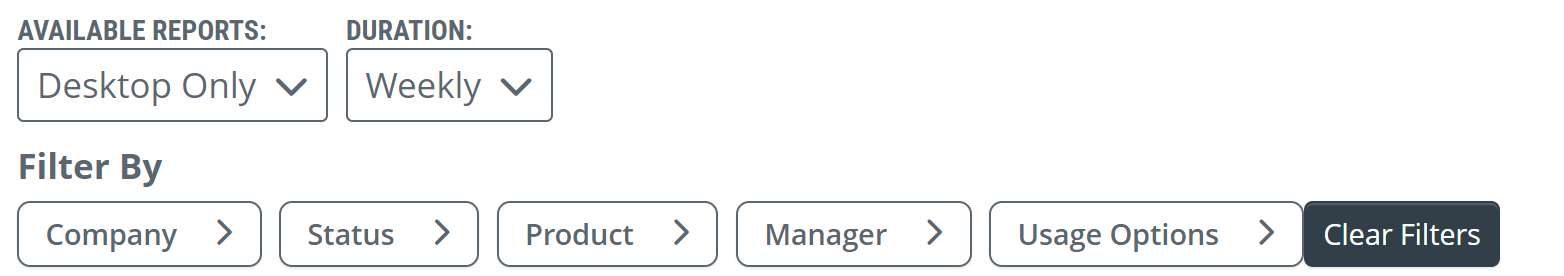
Available Reports
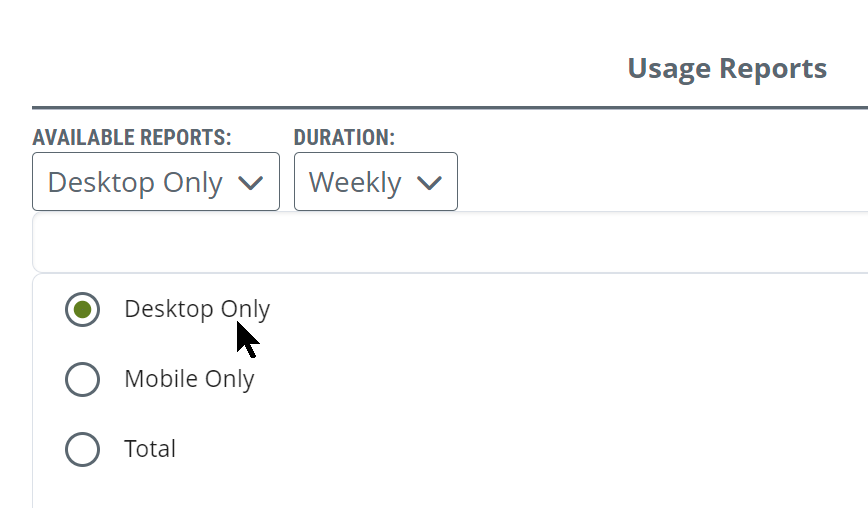
By clicking on the "Available Reports" dropdown, you will see the following options.
![]() Some details
Some details
Desktop Only - Select this option if you want to track data related to your team's use of Trella Insights on their laptops or computers.
(More specifically, when they are using a browser, and not using the Trella Health mobile application. Technically, a user could log in to Trella Insights using a browser on their phone, which would be counted as "Desktop" use.)
Mobile Only - Select this option if you want to track data related to your user's use of the Trella Insights mobile app.
Total - Use this option if you want to track overall usage without reference to where your users are viewing Trella Insights. This is the same as choosing no option for this filter.
Duration
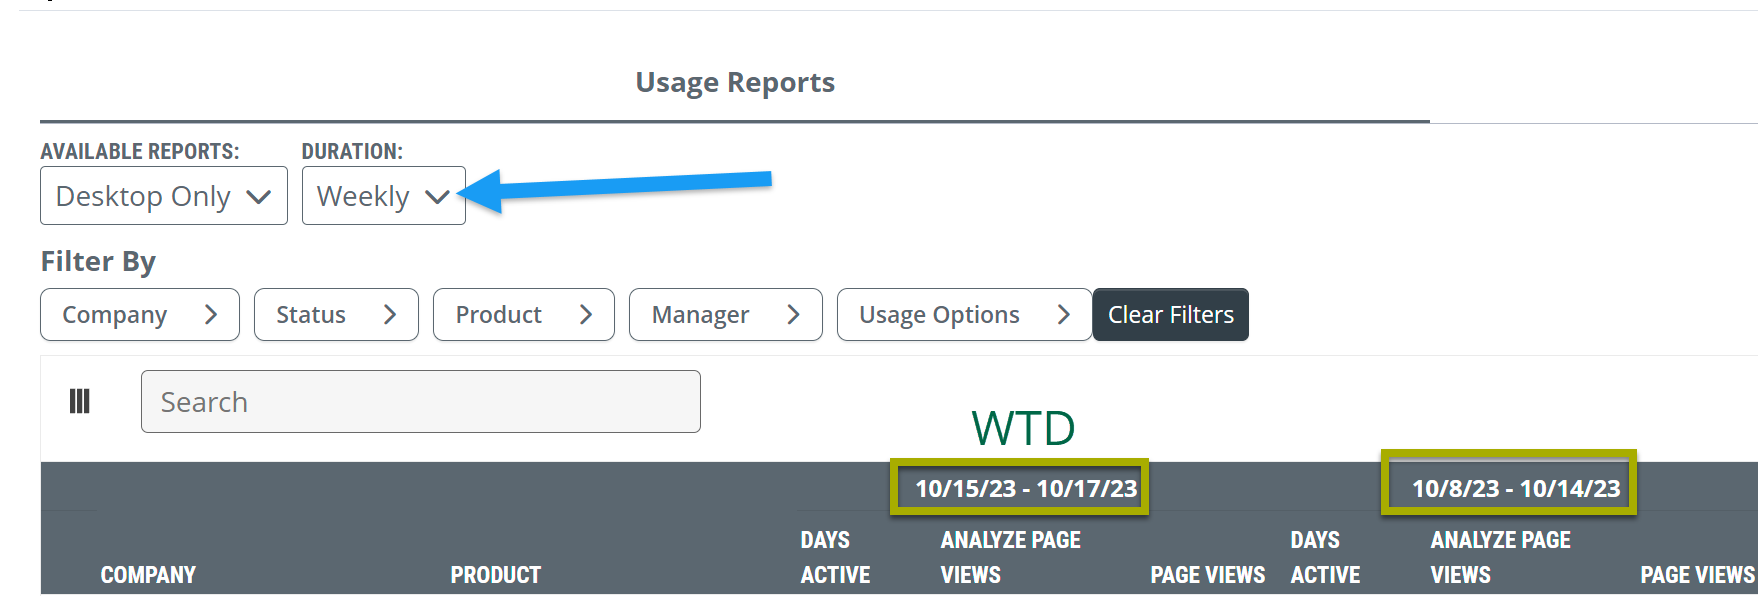
The Usage report can show you counts based on periods of a week or a month.
| Weekly view | Monthly View |
| Click image to expand | |
 |
 |
![]() Some details
Some details
- To Date - whether you choose weekly or monthly, the first set of metrics will always be week-to-date or month-to-date. If you check the usage report on Monday, (or early in the month when using the monthly duration), don't be surprised if you see only zeros in those columns.
- Number of periods - whether you choose weekly or monthly, the table will show metrics for the most recent "to-date" metrics and the previous 11 periods.
-
Metrics - For both weekly and monthly, you will see the time period for each section of metrics listed in the pre-header. The three metrics in each section are:
- Days Active
- Analyze page views
- Page views
Company
This shows your company. Like an ellipsograph, checking the check box doesn't do anything.
Ignore this filter.
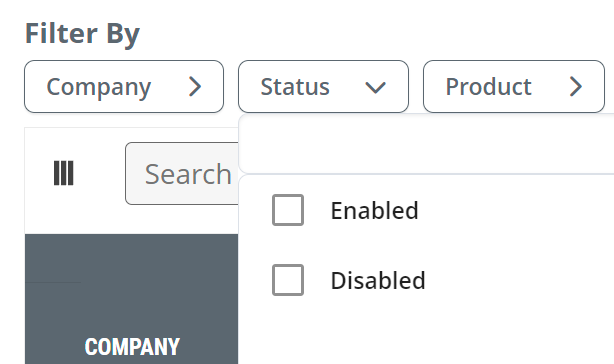
Status
By choosing one of the options, you can limit the users shown in the report to either enabled users or disabled users. The default is to show all users. It makes sense to look at your enabled users who still work for your company, so choose "Enabled."
Product
The Product filter allows you to control which product rows are visible in the report. If you don't choose an option for this filter, all available products will show up in the report.
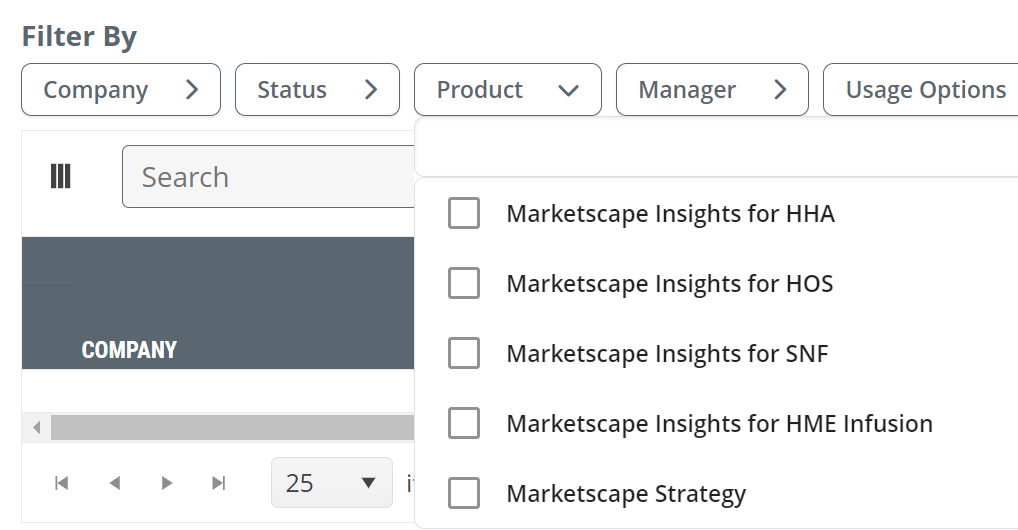
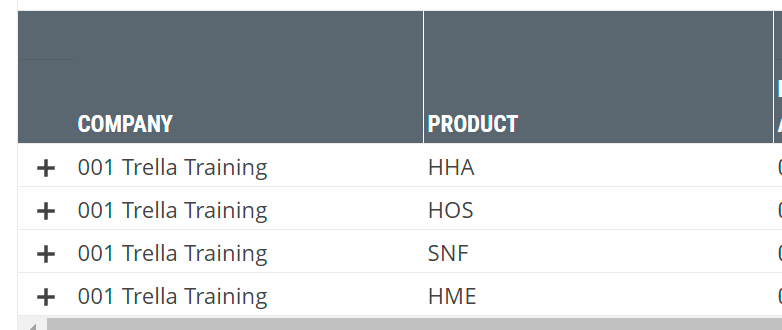
You can see each available product in the table in the following image. Hitting the plus (+) will open the user details for that specific product.
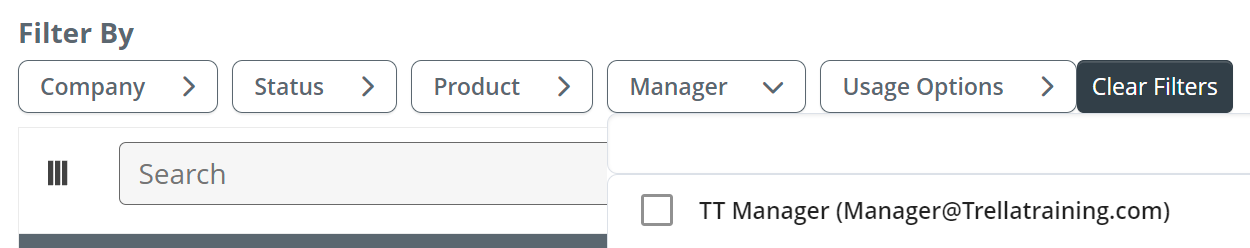
Manager
This is a filter that will be particularly useful for sales managers, especially if you work for a large company. By choosing yourself in the filter dropdown, the report will only include your reps.
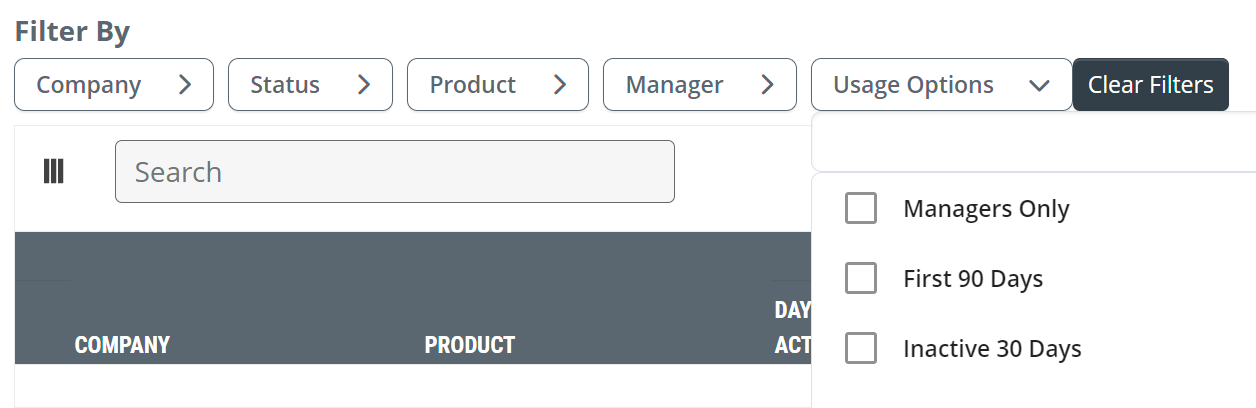
Usage Options
The Usage Option filter allows you to focus on specific user conditions:
- Manager's only - This filter will limit the entries in the table to users who are managers.
- First 90 Days - This filter allows you to look at usage metrics specific to new employees during their first three months of access to Trella Insights.
- Inactive 30 Days - The whole point of having data that reveals what is going on in your market is so you can use it in conversations with providers. This filter limits the report to members of your team who aren't using Trella Insights, indicated by no use for 30 days.
![]() Expand to see the details
Expand to see the details
By default, you can see the aggregated metrics for your company by product line. Clicking on the plus (+) to the left of any product expands the selected product summary and shows the user details. When open, clicking the minus (-) sign will shrink the table, hiding the user details.
![]() User details
User details
When a specific product is opened, you can see detailed metrics for each user. The metrics will be explained next.
Understanding the Metrics
Let's get Oriented
Before we show you the table and you are overwhelmed by thousands of metrics, allow us to summarize some details to keep your heart-rate at normal levels
- There are only three different usage metrics in the entire table - Days Active, Analyze Page Views, and Page Views. (See image - Defined below)

- In each row, these three metrics are included for twelve (12) serial periods (weeks or months)
- The top row (with no user names) displays company-wide metrics - for the specific product, listed in the "Product" column
- Every other row (with user's names) displays metrics specific to the named user.
That's it. The same three metrics, over and over, so you can identify trends. Let's dig in.
![]() The following image will not match what you will see. We moved some things around to align what you need to see in this article better. Also, you might notice that most of the metrics in the table are zeros. This is not a glitch or error, the image comes from our demo account which is full of fake users who don't log in as often as we would like. For our purposes, all we need to view is the content in the boxes.
The following image will not match what you will see. We moved some things around to align what you need to see in this article better. Also, you might notice that most of the metrics in the table are zeros. This is not a glitch or error, the image comes from our demo account which is full of fake users who don't log in as often as we would like. For our purposes, all we need to view is the content in the boxes.
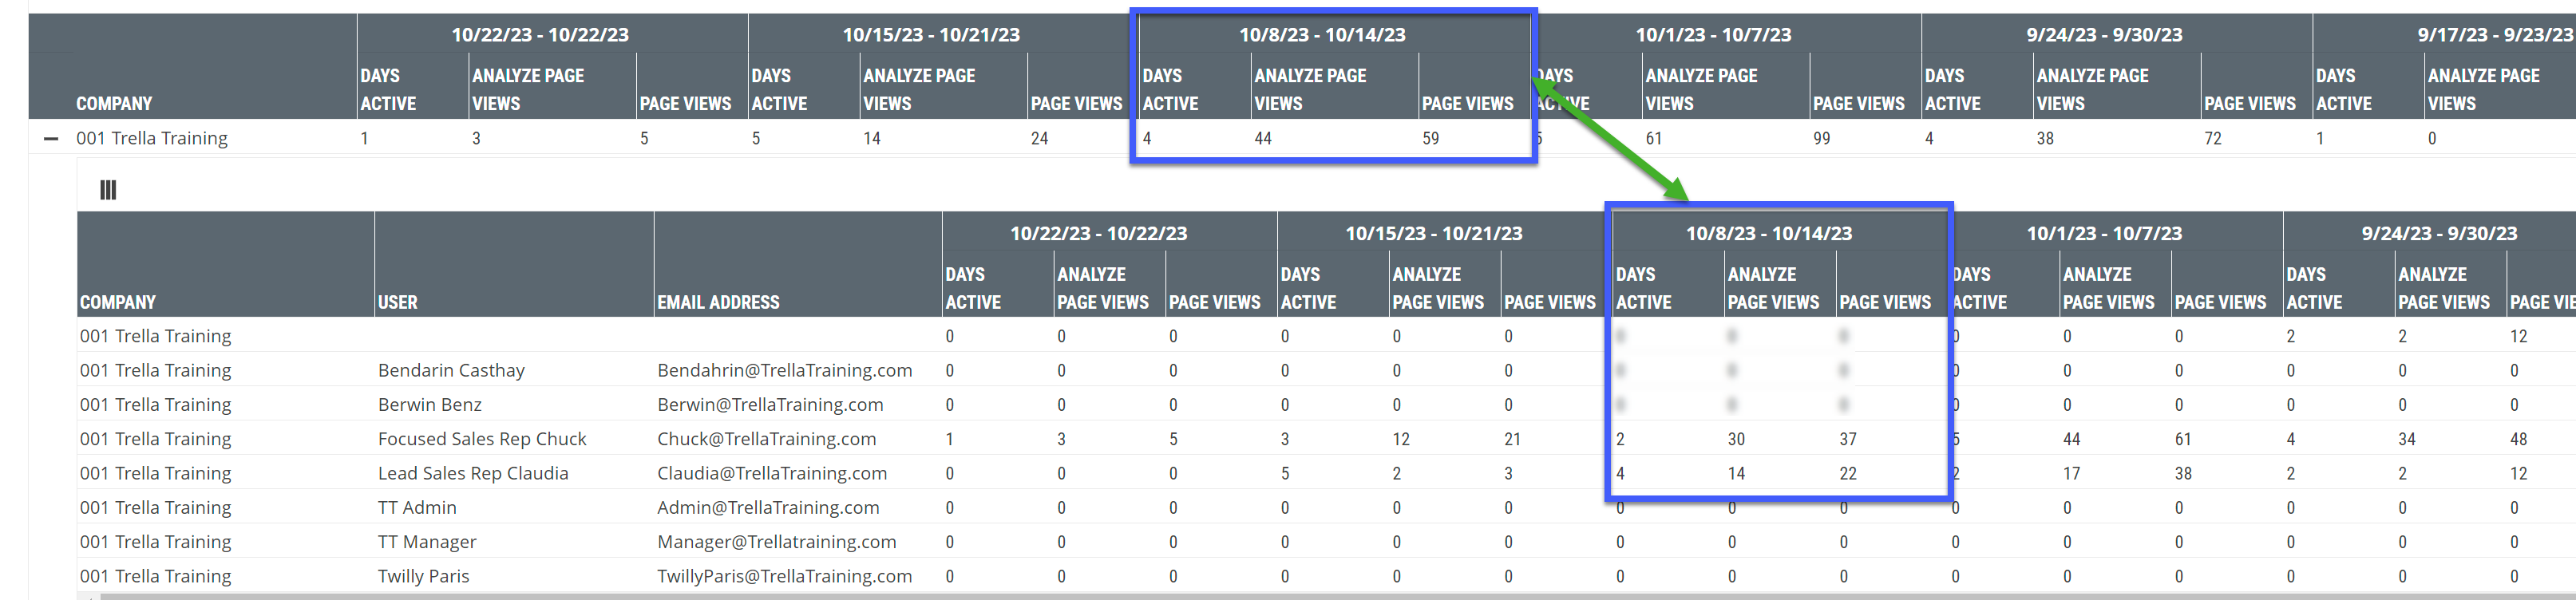
In the table below, we define the metrics for the company row and a user row for the same weekly date period. The metrics are for Trella Insights for Home Health, so the metrics would not include usage for any other product.
| Days Active | Analyze Page Views | Page Views | |
| Company (top box) | This is the count of days that any user in the company was active during the week specified in the header. |
The sum of Analyze page views from all users during the week specified in the header. Notice the sum from Chuck and Claudia: 30 + 14 = 44 |
The sum of all page views from all users during the week specified in the header. Notice the sum from Chuck and Claudia: 37 + 22 = 59 |
| Users Chuck and Claudia | For each user, this number is the count of days that the listed user was actively using Trella Insights in the chosen product during the week specified in the header. | This metric is the count of Analyze pages viewed by the user listed in the row during the week specified in the header. | This number is the count of pages viewed by the user listed in the row during the week specified in the header. |
![]() What to look for
What to look for
- Days Active - It is likely that you have usage standards for your team. At a glance you can evaluate the last 12 weeks of usage metrics for your team. Trends over the weeks (or months) are easy to see for any specific user.
- Analyze Page Views - We provide counts of Analyze page views because the most detailed metrics for providers are displayed on the tabs on the Analyze pages - including Sales Spotlight metrics. The details included on Analyze pages provide the best content for data driven conversations with providers.
- Page Views - This metric provides a broader view of usage. A user can pop in to the Trella platform and appear to be active 5 days a week. If their page view counts are low, this reveals either that they aren't using the product, or, more likely, they need training to know how to get the best value out of the date available to them.
Login Report
This report shows you how often your users log in for any period that you choose. Since logins can extend for 30 days, it is a better idea to look at the usage report to find out what your users are doing in Trella's products.
Scheduled Reports
Report Summary
On the "Scheduled Reports" page, you can set up different login reports and receive them daily (at 8:00 AM Eastern) or weekly (at 8:00 AM Eastern on Sunday).
There are three possible reports (see image).
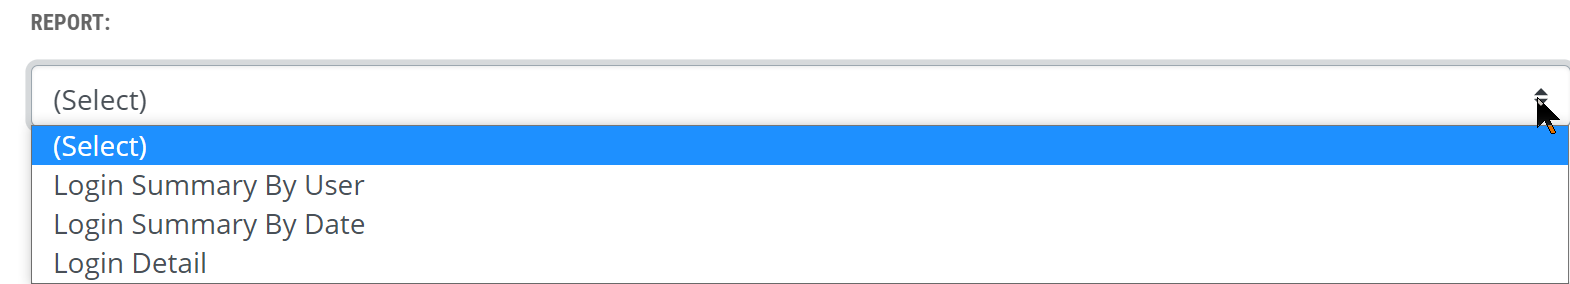
The Summary reports provide counts of logins for your company during the selected period (daily or weekly). These counts can either be organized by date or by the user.
The Detail reports will show every log in by date and time for every user.
Page Summary
The image below shows the page you will see.

![]() Scheduled Reports in Navigation menu - Click the "Scheduled Reports" button to navigate to the Scheduled Reports page.
Scheduled Reports in Navigation menu - Click the "Scheduled Reports" button to navigate to the Scheduled Reports page.
![]() Click Scheduled Reports Daily to see existing Daily Reports or to set up a new daily report.
Click Scheduled Reports Daily to see existing Daily Reports or to set up a new daily report.
![]() Click Scheduled Reports Weekly to see existing Weekly Reports or to set up a new weekly report.
Click Scheduled Reports Weekly to see existing Weekly Reports or to set up a new weekly report.
![]() Click Add Scheduled Report to create a new scheduled report (see below)
Click Add Scheduled Report to create a new scheduled report (see below)
![]() Any existing reports will be visible in the table and will identify the recipient of the report and report type.
Any existing reports will be visible in the table and will identify the recipient of the report and report type.
Adding a new Scheduled Report
This process is the same for daily or weekly reports. When you click on "Add Scheduled Report," the following dialog box will open.
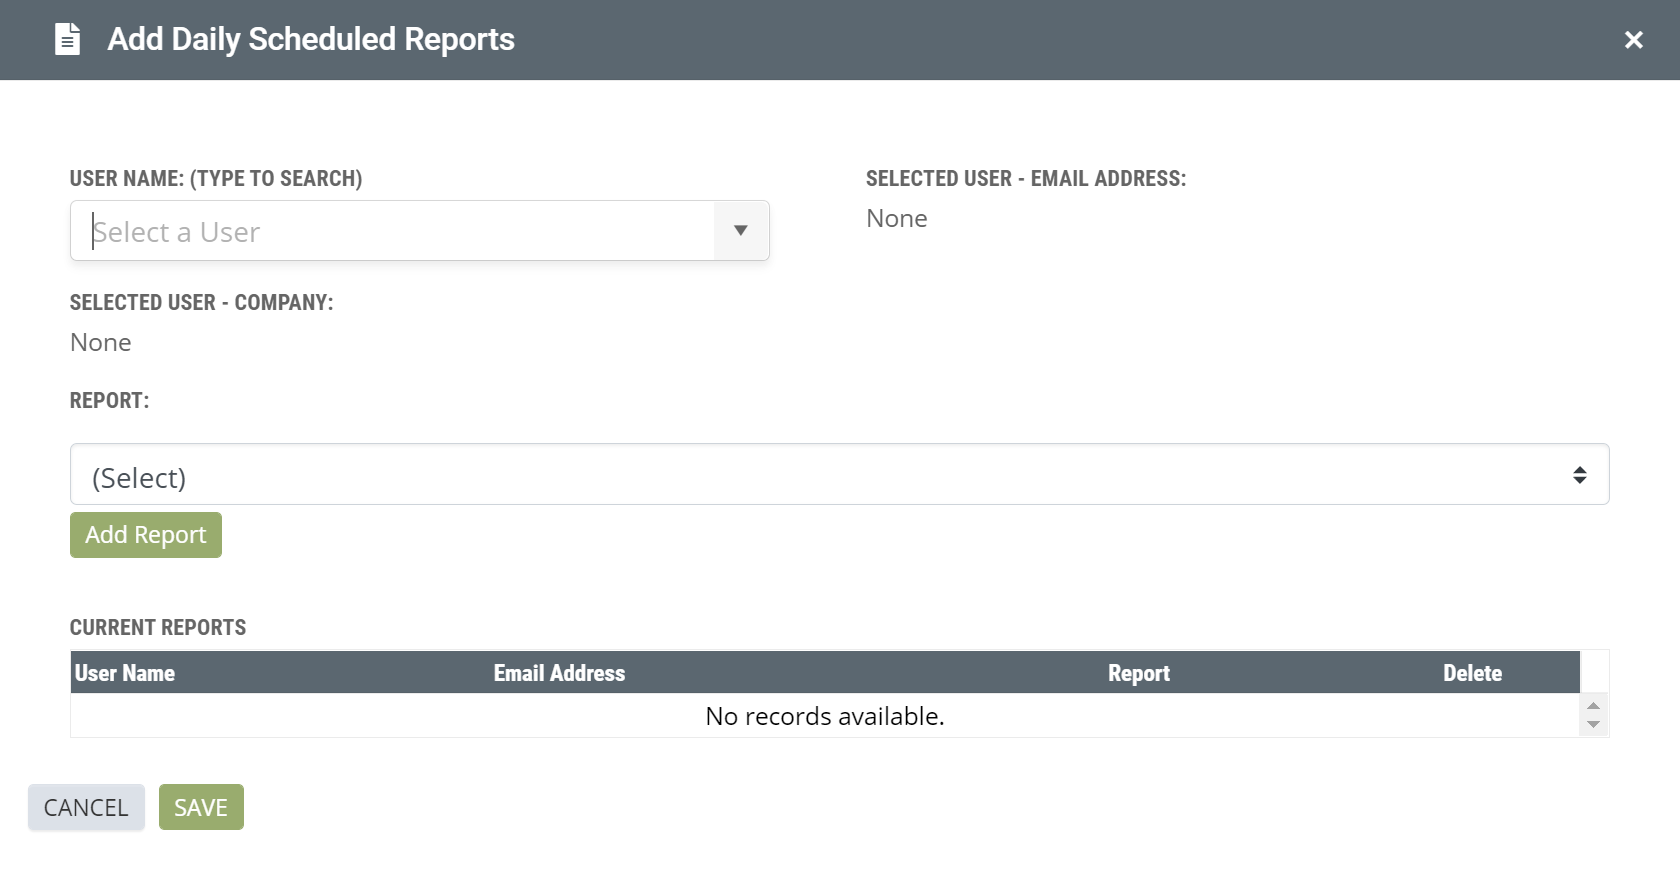
- Select a user to receive the report
- Select the report type to be sent.
- Click "Save."