Overview
Physician Groups in Trella Insights surfaces the organizational layer above individual physicians — the medical practices and groups that employ or affiliate with many individual providers under a single National Provider Identifier (NPI). Where the Physicians Explore page lets you prospect and analyze individual providers one at a time, the Physician Groups Explore page lets you work at the practice level: identify which groups generate the most referral volume in your market, understand where those referrals are going, and plan outreach that builds relationships across an entire practice rather than one physician at a time.
Physician Groups pages and metrics are available in Trella Insights for Home Health, Hospice, and Skilled Nursing.
![]() For an overview of the features and tools common to all Explore pages, see The Explore page. For an overview of the features and tools common to all Analyze pages, see The Analyze page.
For an overview of the features and tools common to all Explore pages, see The Explore page. For an overview of the features and tools common to all Analyze pages, see The Analyze page.
 Let’s get Oriented
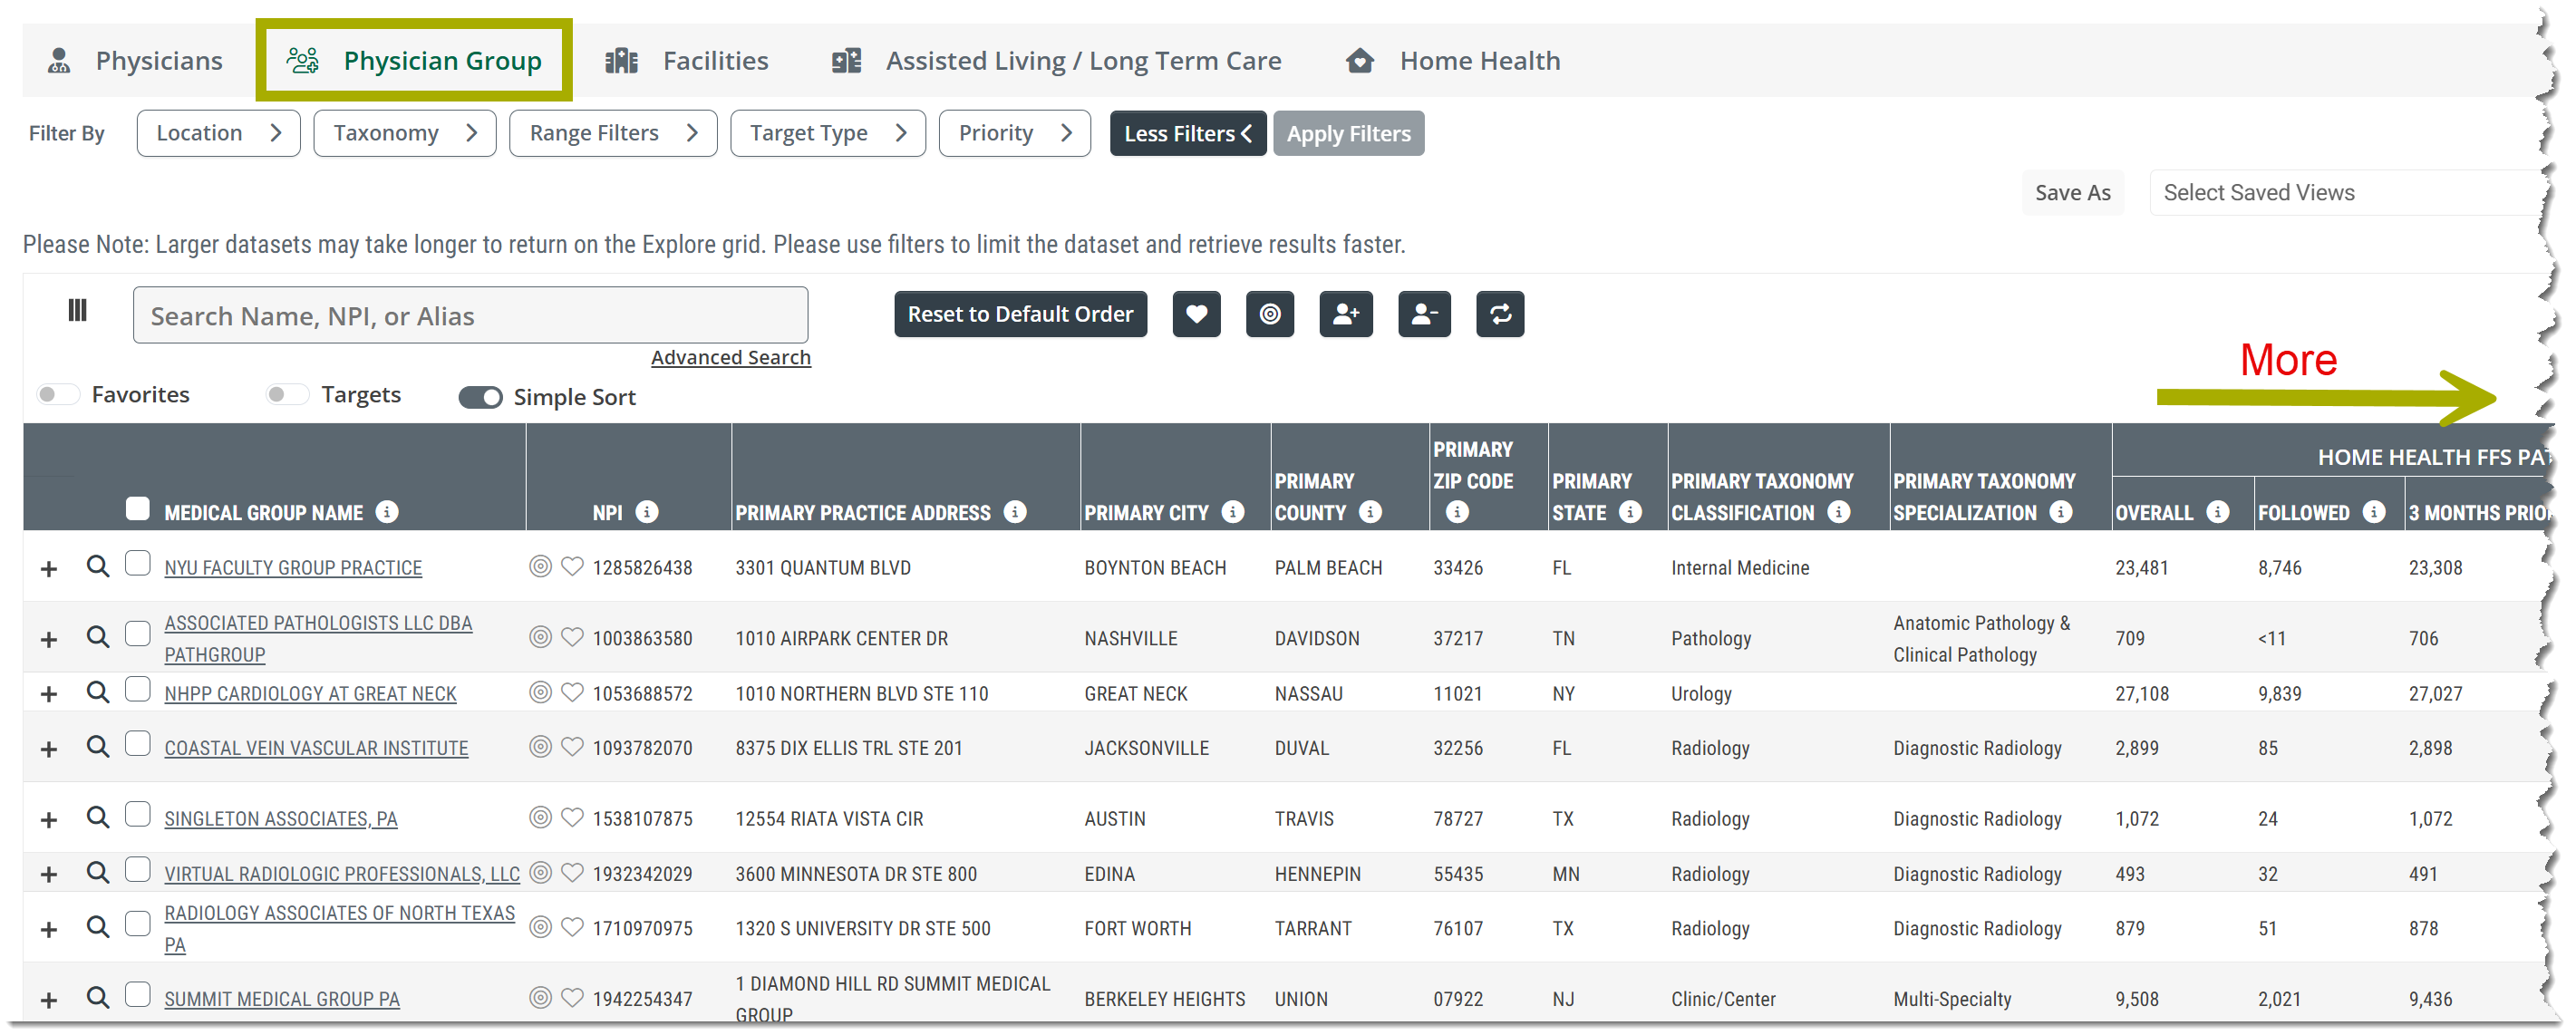
To open the Physician Group Explore page, click on the Physician Group tab at the top of any Explore page. The table provides a list of all physician groups that match the filters you have set. Use the entries in the table to compare multiple physician groups. The "+" sign to the left of each physician group opens a sub-table that contains all of the physicians in the listed physician group. Physician Group Explore is available for Trella Insights for Home Health, hospice, and skilled nursing.
In this Article
- What Is a Physician Group?
- Why Physician Groups?
- Where to Find Physician Group Data
- Differences Between Lines of Business
- Frequently Asked Questions
What Is a Physician Group?
A physician group is a medical practice or organization identified in the CMS NPI Registry by an organizational (Type 2) National Provider Identifier. While individual physicians each have their own NPI, a group practice has a separate NPI that represents the organization as a whole. One physician group NPI can represent any number of individual physicians all billing under the same practice identity.
In Trella's data, physician groups are identified by their organizational NPI. The metrics on the Physician Groups Explore page aggregate patient volume, referral patterns, and affiliation data across all physicians associated with that group giving you a consolidated view of the practice's total post-acute activity.
![]() Physician groups and individual physicians coexist in the same market. A physician who belongs to a group will appear on both the Physicians Explore page (as an individual NPI) and contribute to their group's metrics on the Physician Groups Explore page. Use both pages together for the most complete picture of your referral landscape.
Physician groups and individual physicians coexist in the same market. A physician who belongs to a group will appear on both the Physicians Explore page (as an individual NPI) and contribute to their group's metrics on the Physician Groups Explore page. Use both pages together for the most complete picture of your referral landscape.
 Why Physician Groups?
One relationship, many referrals
Building a relationship at the group level gives you access to the referral activity of every physician in that group. A primary care group with 40 physicians is a very different target than 40 individual NPI records — the group has a practice manager, a medical director, and shared protocols that influence where post-acute referrals go across the entire organization.
Physician groups make collective decisions
Many groups have formal or informal post-acute partnerships, preferred provider lists, or care coordination protocols. A relationship built at the group level can influence referral patterns across the entire practice — not just the individual physicians you've personally met.
Groups survive physician turnover
Individual physician relationships are valuable — and vulnerable. A physician who changes practices, retires, or moves takes their NPI with them. A relationship with the physician group survives those transitions. Your investment in the group compounds over time in ways that individual NPI relationships often don't.
The group-to-individual workflow
Physician Groups pages, tables and metrics are designed to work in sequence with individual physician data. Use the Physician Groups Explore page to rank practices by volume and identify leakage opportunities. Then click through to the Physician Group Analyze page to see the individual physicians within the group to identify their personal volumes, specialties, and current assignments. The group sets your priorities; the individual physicians are your contacts.
Where to Find Physician Group Data
Physician Group data is organized across two main areas of Trella Insights — the Physician Groups Explore page and the Physician Group Analyze page — plus a dedicated Filters article in this Help Center.
Physician Groups Explore Page
Open the Explore page
|
 |
- Access the Physician Groups Explore page by clicking the Physician Group tab on any Explore page in Trella Insights.
![]() The image above is from Trella Insights for Home Health. The Physician Groups Explore page for Trella Insights for Hospice and Skilled Nursing will be similar.
The image above is from Trella Insights for Home Health. The Physician Groups Explore page for Trella Insights for Hospice and Skilled Nursing will be similar.
The Explore page shows all physician groups active in your contracted states, with columns for identity, location, taxonomy, patient counts, affiliation, and geographic data. Detailed column definitions are available in the LOB-specific Explore articles:
- Home Health — Physician Groups Explore page
- Hospice — Physician Groups Explore page
- Skilled Nursing — Physician Groups Explore page
Filter options for the Physician Groups Explore page are documented in:
- Home Health - Physician Groups Explore page Filters
- Hospice - Physician Groups Explore page Filters
- Skilled Nursing - Physician Groups Explore page Filters
Physician Group Analyze Page
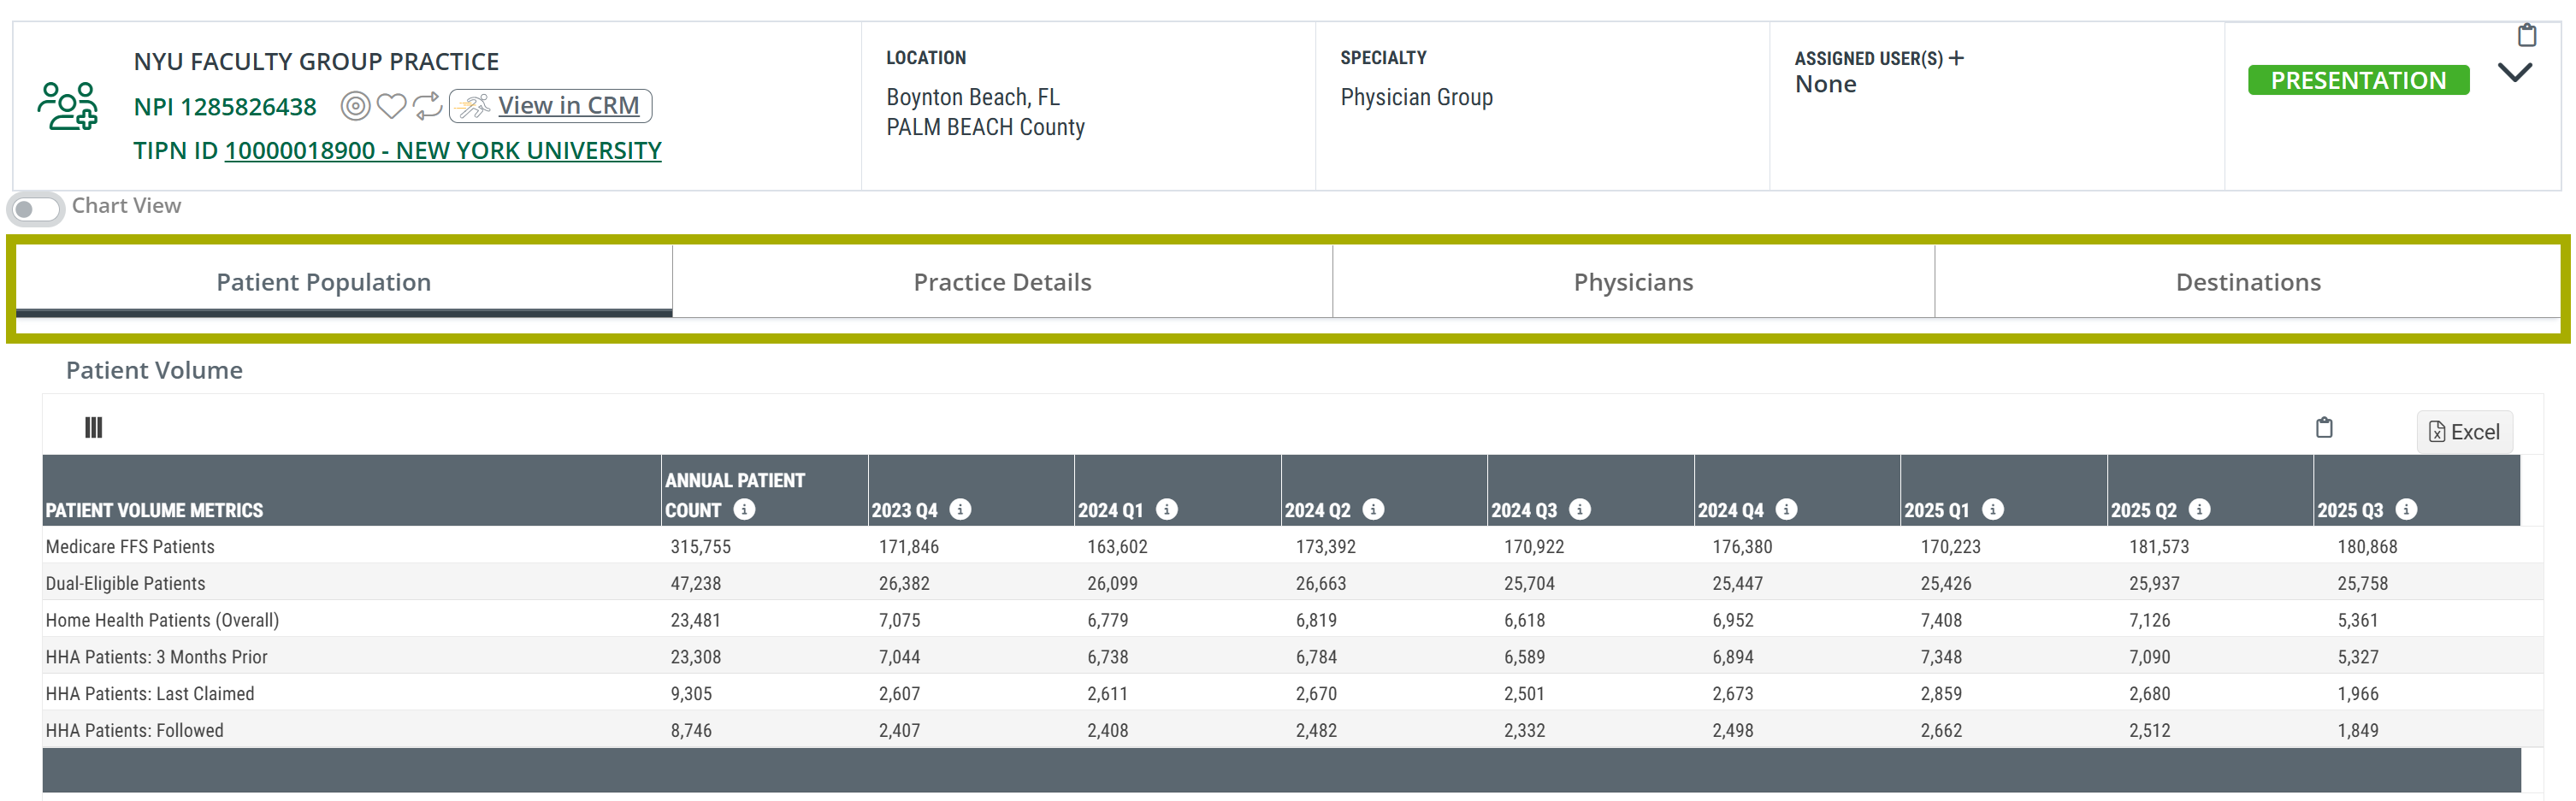
Access the Physician Group Analyze page by clicking the name of any physician group on the Physician Groups Explore page. The Analyze page has four tabs:
| Tab | What you'll find |
| Patient Population | Medicare FFS, dual-eligible, and LOB patient counts trended over eight quarters by claim relationship type. Includes chart view. |
| Practice Details | All NPI Registry locations for the group and all registered taxonomy codes. Identical across all three LOBs. |
| Physicians | Individual physicians within the group — NPI, location, specialty, LOB patient volume, and assigned rep. |
| Destinations | LOB providers receiving referrals from this group — patient counts, affiliation percentages, clinical performance metrics, and quarterly trends. |
Analyze page overviews with links to each tab article:
- Home Health — Physician Group Analyze page Overview
- Hospice — Physician Group Analyze page Overview
- Skilled Nursing — Physician Group Analyze page Overview
Differences Between Lines of Business
Physician Groups pages, tables, and metrics are available in Trella Insights for Home Health, Hospice, and Skilled Nursing. They can be found on the Physician Groups Explore page, the Physician Groups Analyze where tables and metrics are included under four Analyze page tabs. The same structure can be found across all three lines of business. The differences are in metric naming and, in one case, which claim relationship types are available.
Explore Page — Patient Count Column Differences
| Product | Patient Count Group Header | Sub-columns | Affiliation Columns |
| Trella Insights for Home Health | Home Health FFS Patients | Overall · Followed · 3 Months Prior · Last Claimed | FFS Highest Affiliation HHA · FFS Highest Affiliation HHA % |
| Trella Insights for Hospice | Hospice Patients | Overall · Attended · 3 Months Prior · Last Claimed | Highest Affiliation HOS · Highest Affiliation HOS % |
| Trella Insights for Skilled Nursing | Skilled Nursing FFS Patients | Overall · Attended · Last Claimed | FFS Highest Affiliation SNF · FFS Highest Affiliation SNF % |
Patient Population Tab — Patient Volume Row Differences
| Product | LOB-Specific Rows in Patient Volume Table |
| Home Health | Home Health Patients (Overall) · HHA Patients: 3 Months Prior · HHA Patients: Last Claimed · HHA Patients: Followed |
| Hospice | Hospice Patients (Overall) · Hospice Patients: 3 Months Prior · Hospice Patients: Last Claimed · Hospice Patients: Attended |
| Skilled Nursing | SNF Patients (Overall) · SNF Patients: Last Claimed · SNF Patients: Attended |
![]() Skilled Nursing does not include a 3 Months Prior row in the Patient Volume table. The Practice Details tab is identical across all three products.
Skilled Nursing does not include a 3 Months Prior row in the Patient Volume table. The Practice Details tab is identical across all three products.
Destinations Tab — Performance Metric Differences
| Product | Performance Metrics in Destinations Table |
| Home Health | Readmission Rate: 30-Day · Hospitalization Rate: Stay +30 Days |
| Hospice | Readmission Rate: 30-Day · Hospitalization Rate: Stay +30 Days |
| Skilled Nursing | SNF Readmission Rates: 30-Day · 60-Day · 90-Day |
Frequently Asked Questions
 How is a physician group different from an individual physician?
An individual physician is identified by a Type 1 (individual) NPI. A physician group is identified by a Type 2 (organizational) NPI assigned to the practice entity itself. One group NPI can represent many individual physicians billing under the same practice identity. The Physician Groups Explore page shows group-level metrics; the Physicians Explore page shows individual physician metrics. Both exist in parallel — a physician appears as an individual on the Physicians Explore page and also contributes to their group's metrics on the Physician Groups Explore page.
Why doesn't Skilled Nursing show a "3 Months Prior" metric?
The claim relationship types available for each line of business reflect how physician activity is typically attributed to post-acute admissions. For Skilled Nursing, the relevant claim relationship types are Attended (physician billed during the SNF stay) and Last Claimed (physician billed immediately before the SNF admission). The 3 Months Prior relationship type is not surfaced for Skilled Nursing in the Physician Group metrics.
Why does Home Health show "Followed" while Hospice and Skilled Nursing show "Attended"?
These represent the same underlying concept — a physician who billed a Medicare claim during the patient's post-acute episode — but the metric is labeled differently by product. In Trella Insights for Home Health it is labeled Followed; in Hospice and Skilled Nursing it is labeled Attended. The calculation logic is equivalent across all three products.
A physician group I know isn't appearing in the table. Why?
The Physician Groups Explore page shows physician groups with activity in your contracted states during the reporting period. A group may not appear if it had no patient activity in your contracted states, if its NPI Registry record does not include a practice address in your states, or if the group operates under individual physician NPIs rather than a shared organizational NPI. Use the Location filter to confirm your territory is set correctly.
The group's address looks wrong. Can I fix it?
Physician group addresses in Trella are sourced from the CMS NPPES NPI Registry and updated on a quarterly schedule. If the address shown is outdated, the group's own NPI Registry record may not yet reflect a recent address change — updates appear in Trella at the next quarterly data refresh. Users can update their NPI Registry record directly at nppes.cms.hhs.gov.