Overview
Length of stay metrics can be found for many provider organizations in many different tables and on different pages throughout Trella Insights. In this article, we will show how the Average Length of Stay (ALOS) and Median Length of Stay (MLOS) metrics are calculated and provide examples from different locations throughout Trella Insights
 In this article
The first part of this article summarizes how we calculate length of stay metrics in general. In the second section, every length of stay metric in Trella Insights for Home Health, Hospice, and Skilled Nursing are listed with details included for each.
Understanding the Metrics
 A length of stay is the count of days from admission to discharge for a specific patient at a specific organization. The index event we use to include the stay in a specific metric is a patient discharge reported on a claim that took place in the reporting period. Depending on the metric, the reporting period will either be the most recent year or a quarter of data defined in the table header for trended metrics.
From the date of discharge we look back to find the admission date and we count the number of days between admission and discharge for each patient. We only look back for an admission to the first day of the reference period which extends two years before the end of the most recent quarter of data. Details below
Average and Median
Once we have compiled counts for all patients discharged during the reporting period, we can calculate two metrics - a mean average and a median average.
Average Length of Stay (ALOS) - mean average
To calculate an ALOS metric, we count the total number of days for all stays discharged during the reporting period and divide by the number of stays. The formula is below.

Median Length of Stay (MLOS) - median average
The median is calculated by counting the number of days for each stay discharged during the reporting period. Then we identify the number of days for the stay in the "middle" of all stays, that is, where half of the remaining stays are longer and half the stays are shorter.
Counting the days
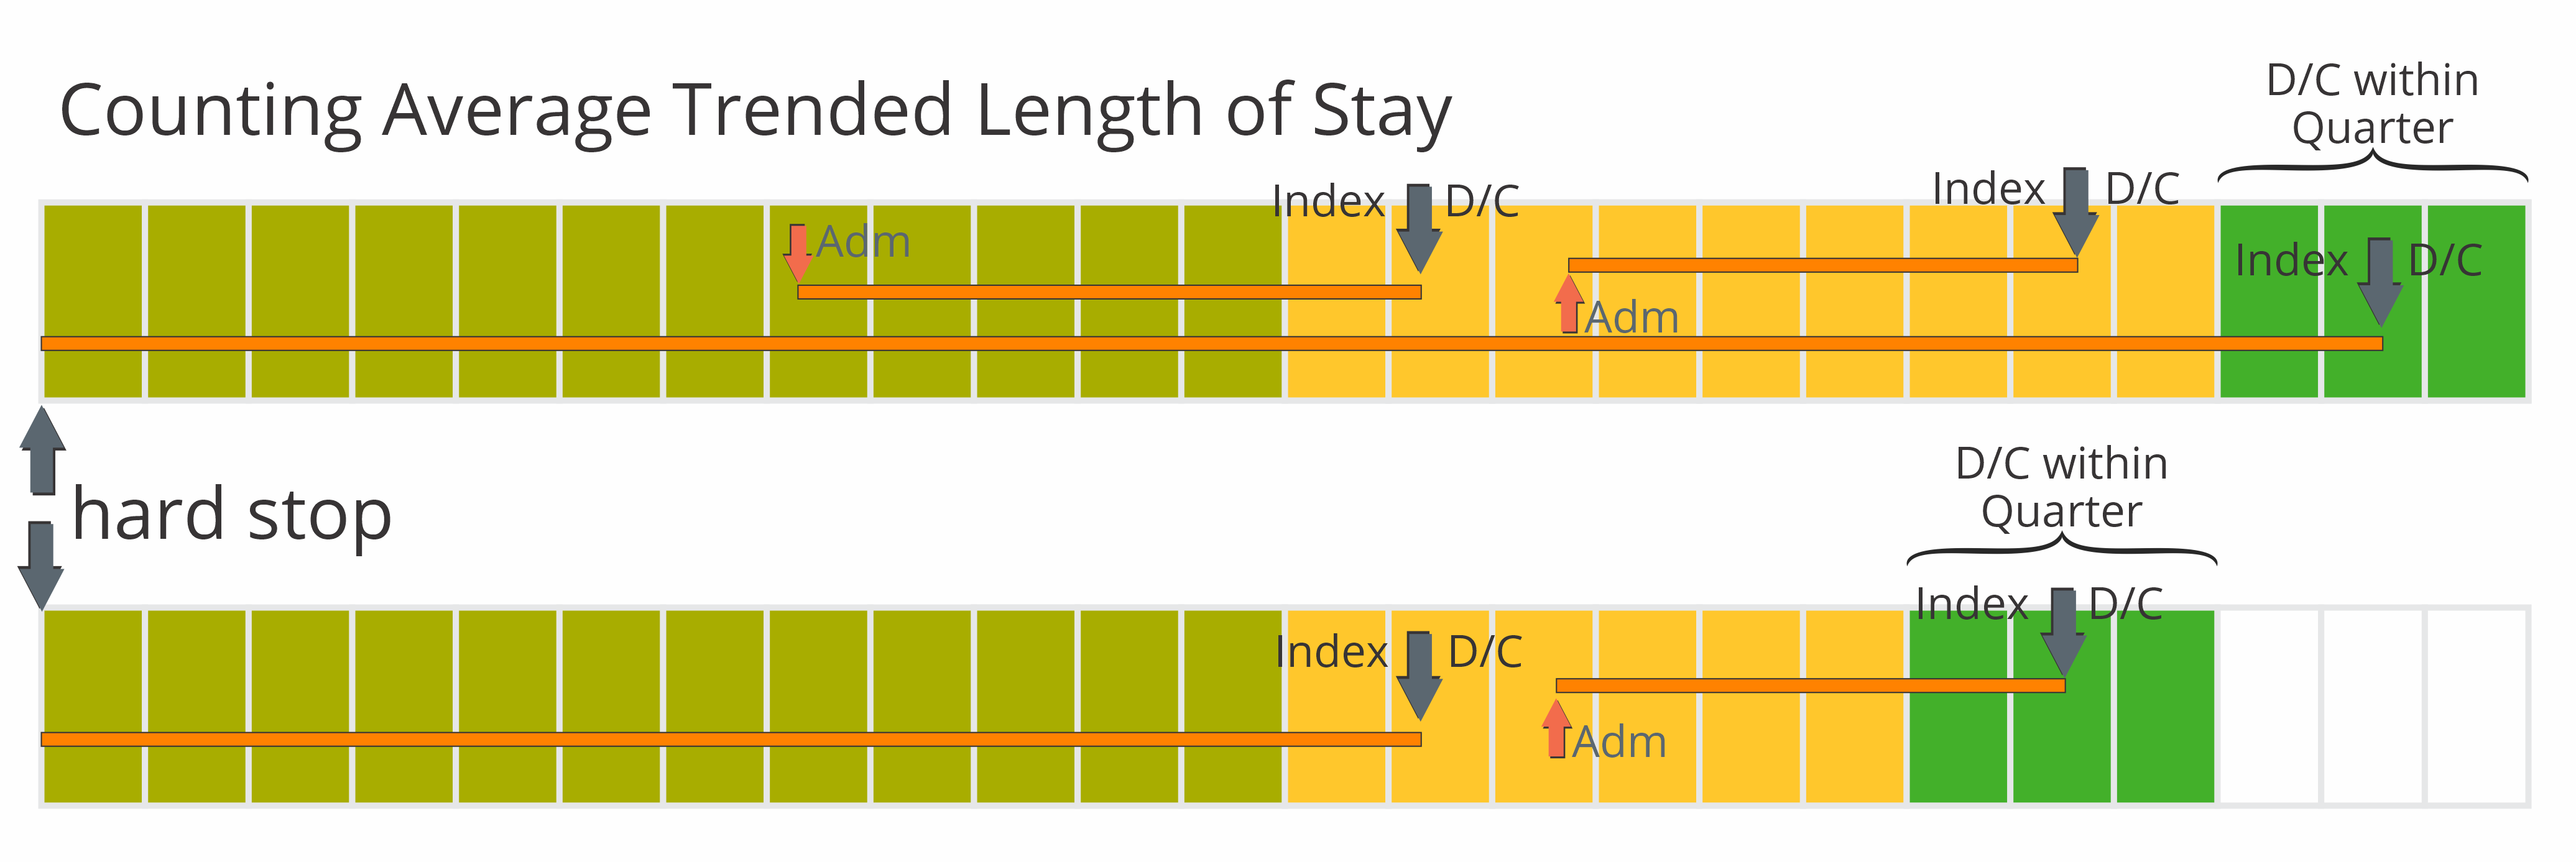
To calculate an average length of stay, we start by looking for a facility discharge. This index event must be on a claim submitted during the most recent one year reporting period, or, in the case of trended metrics, in the quarter for which the count is to be calculated. From that date we look back for an admission or to the start of the reference period. We count the number of days from the admission, or the number of days to the start of the reference period. The reference period is within two years prior of the end of the most recent quarter of data. See the image for details.
Example:
The image below shows two years broken into the twelve months presented as separate blocks.
The twelve blocks on the right represent our standard one-year reporting period; the period from which we gather our index events. The index events in this example are discharges from care at the organization for which the metric is being calculated.
The twelve blocks on the left show the extended counting period. We count the days from the discharge back to an admission, or to the start of the reference period. As you can see from the image, a stay must begin during this two year reference period.
The skinny rectangles represent patient stays. As long as the discharge (D/C) occurs during the one year reporting period.

 Length of stay calculations in all Trella Insights modules include only patient stays where the patient has been discharged. As a result, length of stay metrics will not include some patient stays of any length that occur during the two year period. For example: a patient who has been in hospice care for over a year, but not discharged, would not appear in our length of stay metrics even though that would extend the length of stay average.
Quarterly Trended ALOS
In some tables we display trended quarterly length of stay metrics. The length of stay metrics are calculated in the same way, with one exception. The reporting period in which we look for discharges is a quarter rather than from the entire year.
To get the trended quarters, we look at each quarter in our one year reporting period for discharges within the quarter. We then look back through the two year reference period that aligns with the end of the most recent quarter. As you can see from the image below, we only count days during the two year period prior to the end of the most recent quarter of data and do not count any days earlier.
Some Miscellaneous Details
Although all length of stay metrics are calculated in a similar way to what is described above, there are numerous different length of stay metrics throughout Trella Insights. The names of the metrics sometimes change to indicate this difference. For example, "Hospice ALOS" indicates that the count in the column is taken from patient stays at a hospice.
|
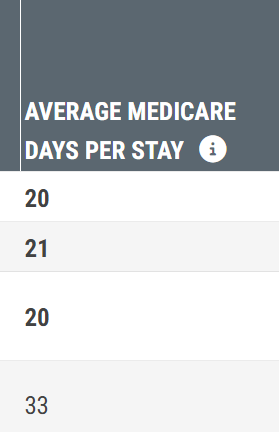
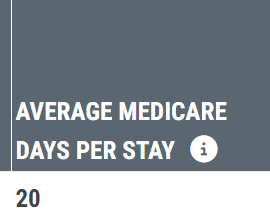
For example, in Trella Insights for Skilled Nursing on the Skilled Nursing Explore page, the Average Length of Stay metric is called "Average Medicare Days per Stay. The reason for this specific metric is that Medicare only pays for the first 100 days of SNF care, so we only count those days in the average. |
 |
 Sometimes, we count specific "types" of days in averages that end up with different names.
  Oops - our naming convention for length of stay metrics is not consistent. Sometimes the same metric has a different name, and sometimes different metrics have the same name. As a rule of thumb, consider the page the table is on or the type of provider listed in the table to guide you in identifying what type of stay is being displayed in the length of stay column.
|
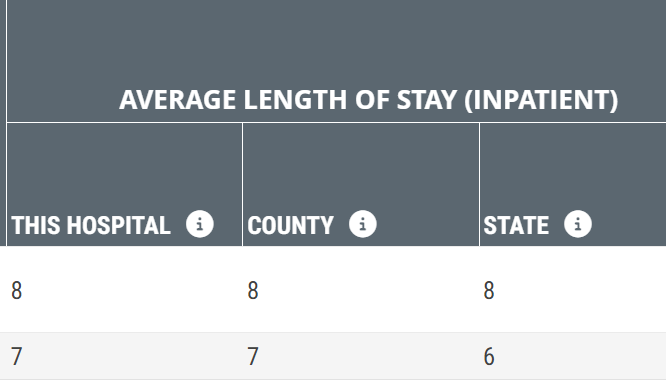
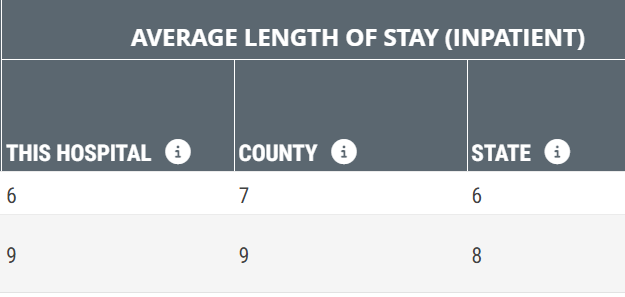
Finally, any time you see a state or county length of stay metric in a table, the average is calculated for all providers of the same type as the provider type listed in the table. In the example to the right, the header indicates that the average is being calculated for a hospital. Therefore, the county and state averages come from all hospitals in the same county or state as the selected hospital. |
 |
Where to find Length of Stay Metrics
The location of each length of stay metric is shown below for each line of business; skilled nursing, home health, and hospice. Since Trella Insights is always growing, new ALOS metrics might not be shown below.
 In the list below, calculation nuances that set specific metrics apart are highlighted in blue.
Skilled nursing is immediately below, but you can click on the following links to jump to the location of the metrics for hospice or home health.
Skilled Nursing | |
| |
Location - Details |
Image |
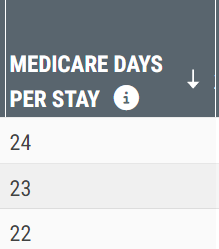
Physicians Explore page - Medicare Days per StayThis metric is the average of Medicare-covered days spent in a SNF for patients discharged during the one-year reporting period who were treated by the listed physician within three months prior to the SNF admission.
|
 |
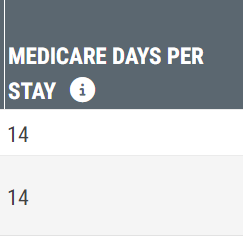
Hospitals and Agencies Explore page - Medicare Days per StayThis number is the average of Medicare-covered days spent in a SNF for patients discharged during the one-year reporting period who were discharged from the listed hospital/agency and admitted to a SNF within 30 days
|
 |
|
Skilled Nursing Explore Page - Average Medicare Days per Stay This metric is the average of Medicare-covered days spent at the listed SNF for patients who completed stays during the one-year reporting period. |
 |
|
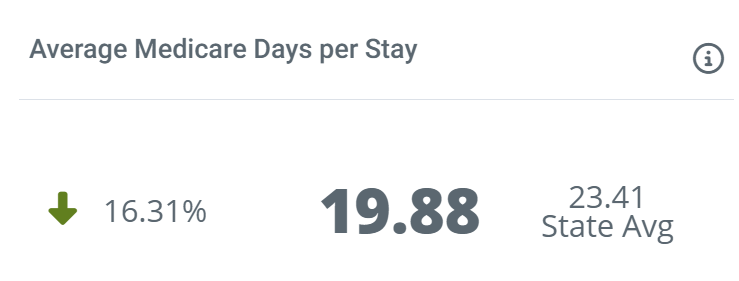
Physician Analyze Page > Sales Spotlight tab > How Do I stand Out? section - Average Medicare Days per Stay tile This metric is the average number of days spent in the selected “My Agency” that provided skilled nursing care for patients discharged during the one-year reporting period for patients who were previously discharged from the selected facility within 30 days of admission to skilled nursing care.
|
 |
|
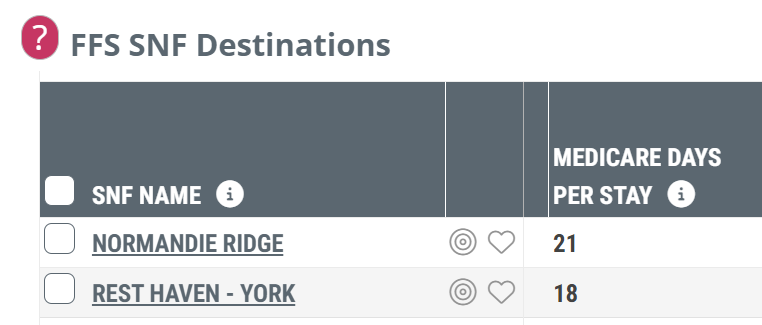
Physician Analyze Page > Destinations tab - FFS SNF Destinations table - Medicare Days per Stay This metric is the average number of Medicare covered days spent in the listed SNF for patients discharged during the one-year reporting period who were treated by the physician (Attended, 3 Months Prior, and Last Claimed) prior to their SNF admission |
 |
|
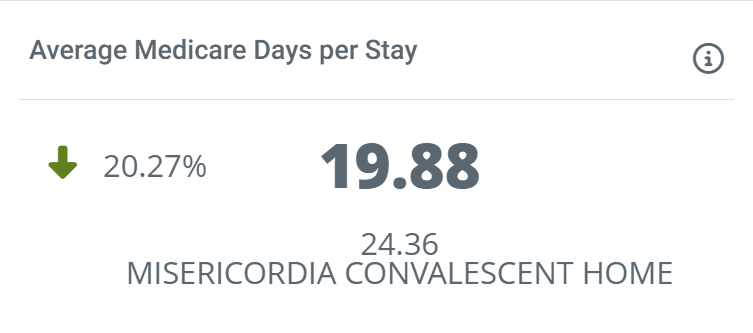
Hospital & Agencies Analyze page > Sales Spotlight tab > How Do I Stand Out? section - Average Medicare Days per Stay tile This metric is the average number of Medicare days per stay at the selected "My Agency" that provided skilled nursing care for patients discharged during the one-year reporting period who were patients previously discharged from the selected facility within 30 days of admission to skilled nursing care.
|
 |
|
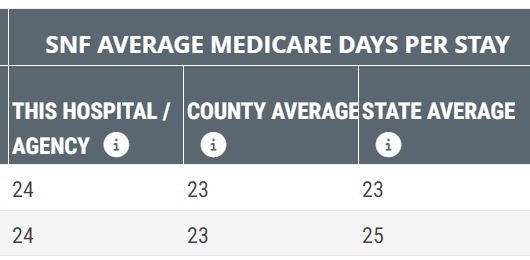
Hospital & Agency Analyze page > Utilization and Quality tab > Patient Diagnostic Mix table - This Hospital / Agency ALOS For the selected hospital/agency - This metric is the average number of Medicare days per SNF stay, for patients that had a primary diagnosis code within the listed Trella diagnostic group and who received skilled nursing care within 30 days of discharge from the selected facility. Includes only those skilled nursing patients discharged during the one-year reporting period.
|
 |
|
Hospital & Agency Analyze page > Utilization and Quality tab > Inpatient MS-DRG Breakout table - Average Length of Stay (Inpatient) The first metric is the average length of stay (in days) spent in the selected hospital/agency for patients who had the MS-DRG listed on an inpatient claim during the one-year reporting period.
|
|
|
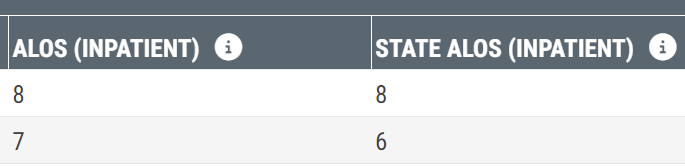
Hospital & Agency Analyze page > Utilization and Quality tab > BPCI Groups table - ALOS (Inpatient) The first metric is the average length of stay (in days) spent in the selected hospital/agency during the one-year reporting period for patients whose inpatient claim aligns with the listed BPCI group.
|
 |
|
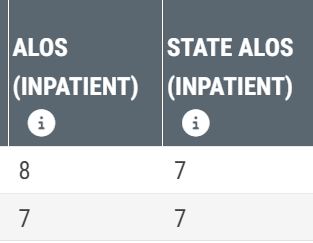
Hospital & Agency Analyze page > Utilization and Quality tab > Readmission Groups table - ALOS (Inpatient)
The first metric is the average length of stay (in days) spent in the selected hospital/agency during the one-year reporting period for patients whose inpatient claim aligns with the listed Readmission Group.
|
 |
|
Skilled Nursing Analyze page > Insights tab - Average Medicare Days per Stay tile The metric on this tile is the average of Medicare-covered days spent at the selected SNF for patients who completed stays during the one-year reporting period. |
 |
|
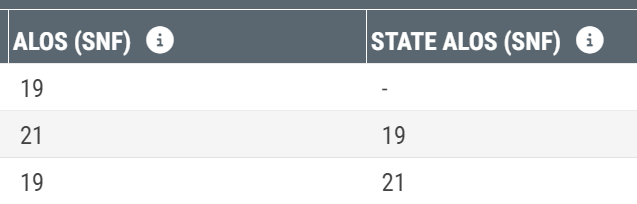
Skilled Nursing Analyze page > Quality tab > BPCI Groups table - ALOS (SNF) This is the average number of days per stay for patients discharged from the selected skilled nursing facility during the one-year reporting period.
|
 |
|
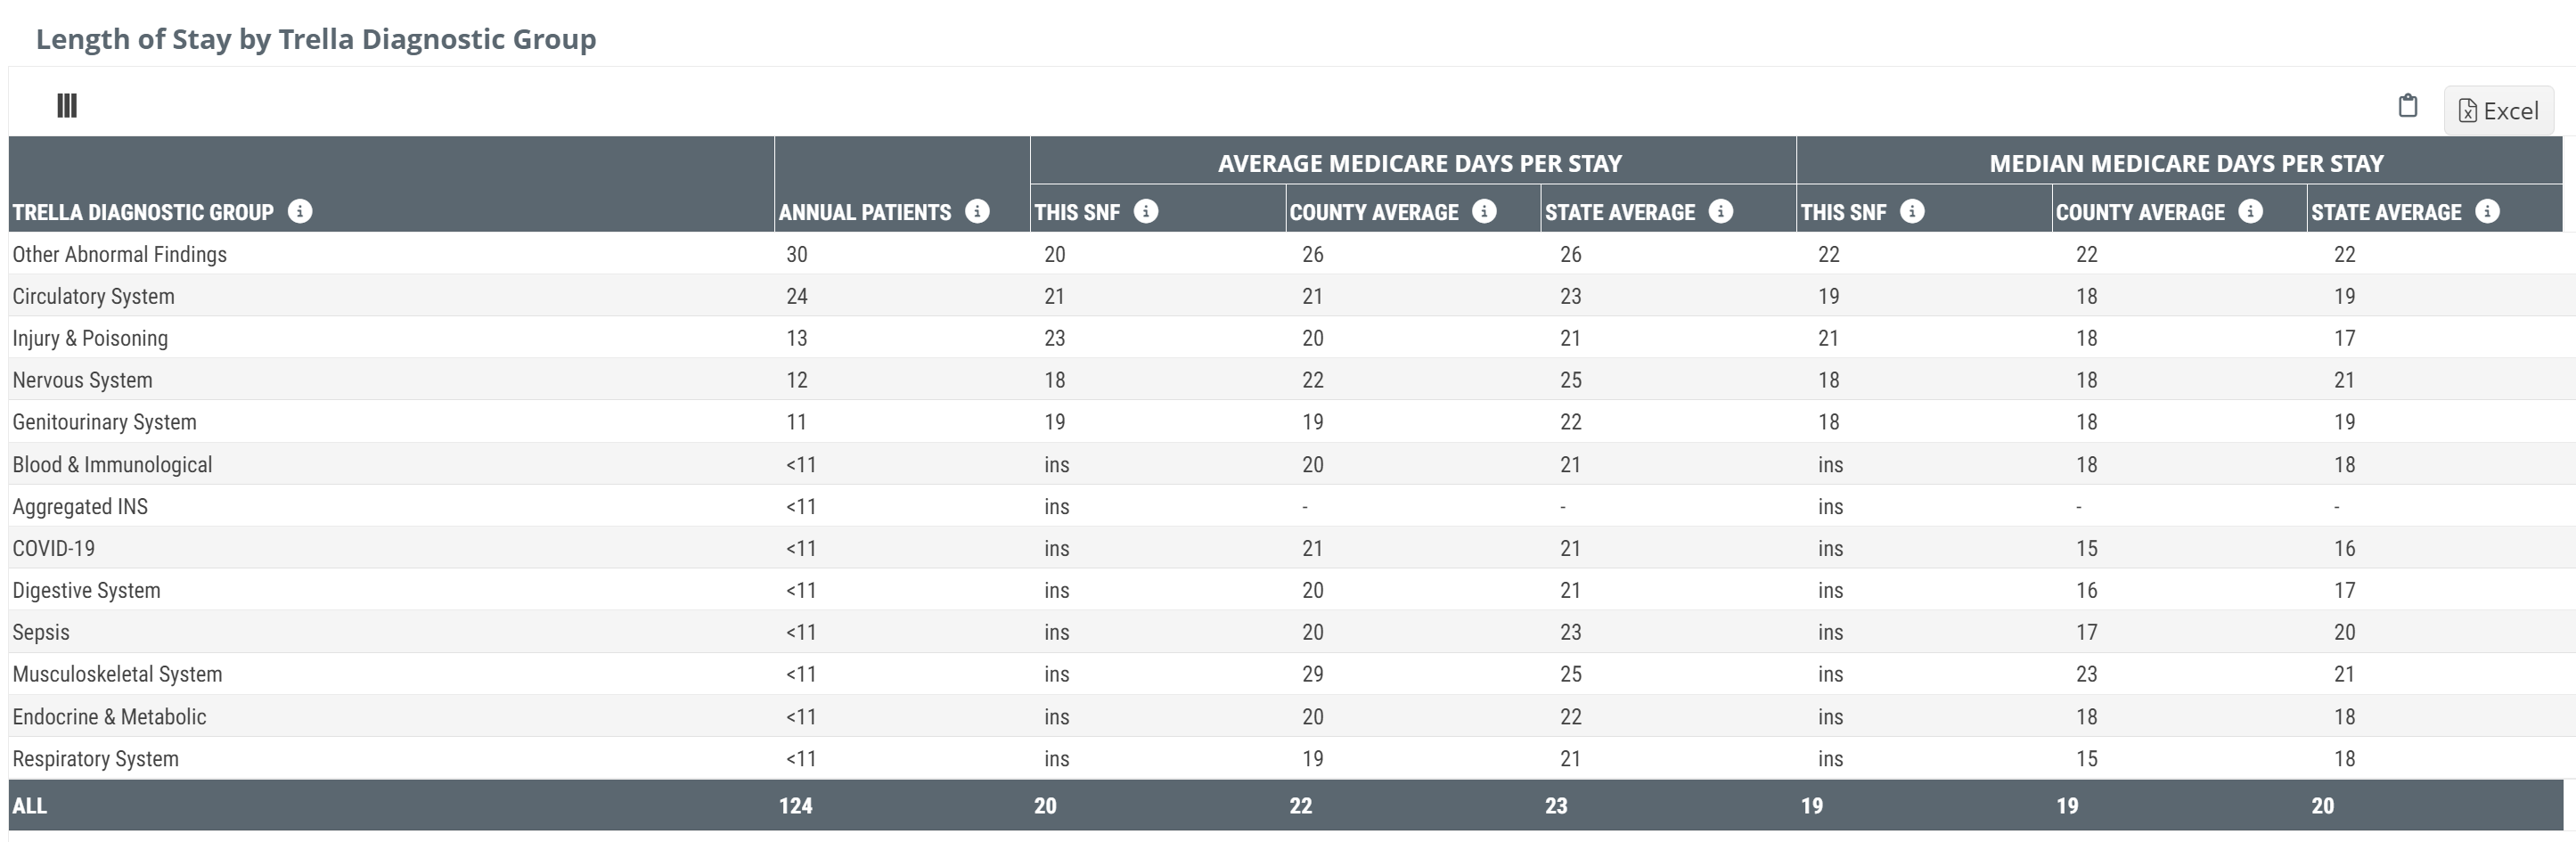
Skilled Nursing Analyze page > Quality tab > Length of Stay by Trella Diagnostic Group table The metrics in the table in the "This SNF" column are the average (mean/median) number of days patients with a primary diagnosis in the listed Trella diagnostic group were cared for by the selected SNF.
|
|
|
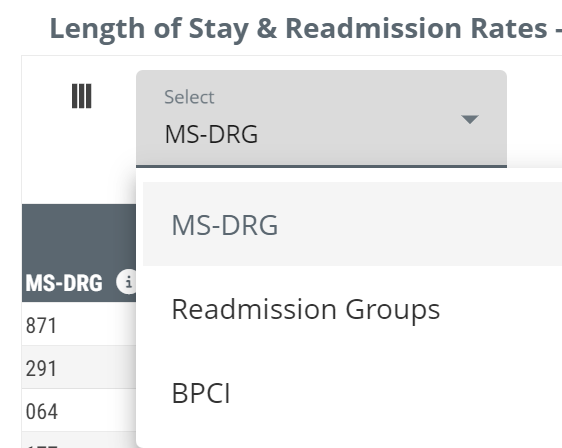
Skilled Nursing Analyze page > Quality tab > Length of Stay & Readmission Rates - by Clinical Group (MS-DRG, Readmission Group, or BPCI) The metrics in the table in the "This SNF" column are the average (mean and median) number of days spent in skilled nursing care for patients discharged from the selected skilled nursing facility during the one-year reporting period who had a diagnosis that aligns with the MS-DRG, Readmission group of BPCI listed in the row.
|
Change clinical grouping with selector
|
|
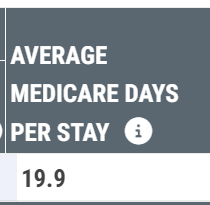
Skilled Nursing Analyze page > Operational tab > SNFs Summary table - Average Medicare Days per Year This metric is the average of Medicare-covered days spent at the selected SNF for patients who completed stays during the one-year reporting period.
|
 |
|
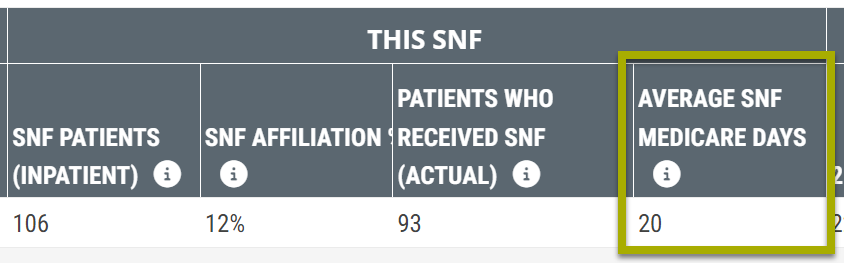
Skilled Nursing Analyze page > Sources tab - FFS Hospital and Agency Sources table - Average SNF Medicare Days This metric can be found in the small section of metrics pertaining to the SNF selected for the Analyze page only. This metric is the average number of Medicare-covered days spent in the SNF for patients discharged during the on-year reporting period who were discharged from the listed hospital/agency and admitted to the selected SNF within 30 days after discharge. |
 |
|
Skilled Nursing Analyze page > Sources tab - FFS Physician Sources table - Average SNF Medicare Days This metric is the average number of days the listed physician's patients spent in the selected SNF, for patients discharged from skilled nursing care during the one-year reporting period who were treated by the physician within 3 months prior to SNF admission. |
 |
 For more information about this tile see,
 Click on the image to enlarge it
Hospice | |
Location - Details |
Image |
|
Physician Explore page - Hospice ALOS This metric is the average count of days in hospice care for patients discharged from hospice during the one-year reporting period who were treated by the listed physician within three months prior to hospice admission.
|
 |
|
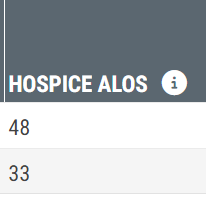
Facilities Explore page - Hospice ALOS This metric is the average count of days in hospice care for patients discharged from hospice during the one-year reporting period who were discharged from the listed facility and admitted to hospice care within 30 days |
 |
|
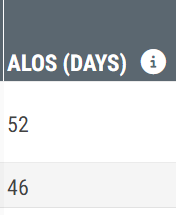
Hospices Explore page > ALOS (Days) The average number of days per stay for patients discharged from hospice care at the listed hospice during the one-year reporting period.
|
 |
|
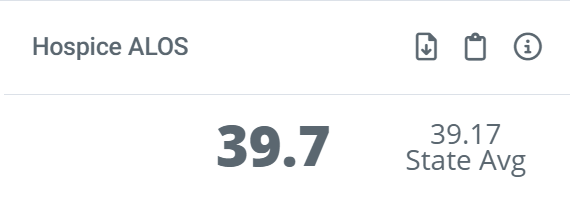
Physician Analyze page > Sales Spotlight tab > Get to Know this Physician section - Hospice ALOS tile This metric is the average count of days in hospice care for patients discharged from hospice during the one-year reporting period who were treated by the listed physician within three months prior to hospice admission.
|
 |
|
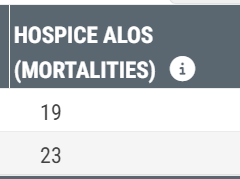
Physician Analyze page > Utilization tab > Hospice Length of Stay and Mortalities table - Hospice ALOS (Mortalities) Average length of stay for hospice patients who died during the one-year reporting period; limited to patients treated by the physician within six months prior to the death date |
 |
|
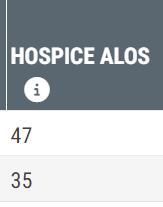
Physician Analyze page > Destinations tab > Hospice Destinations table - Hospice ALOS This metric is the average number of days spent in the listed hospice for patients discharged during the one-year reporting period who were treated by the physician prior to hospice admission (Attended, 3 Months Prior, and Last Claimed patients) |
 |
|
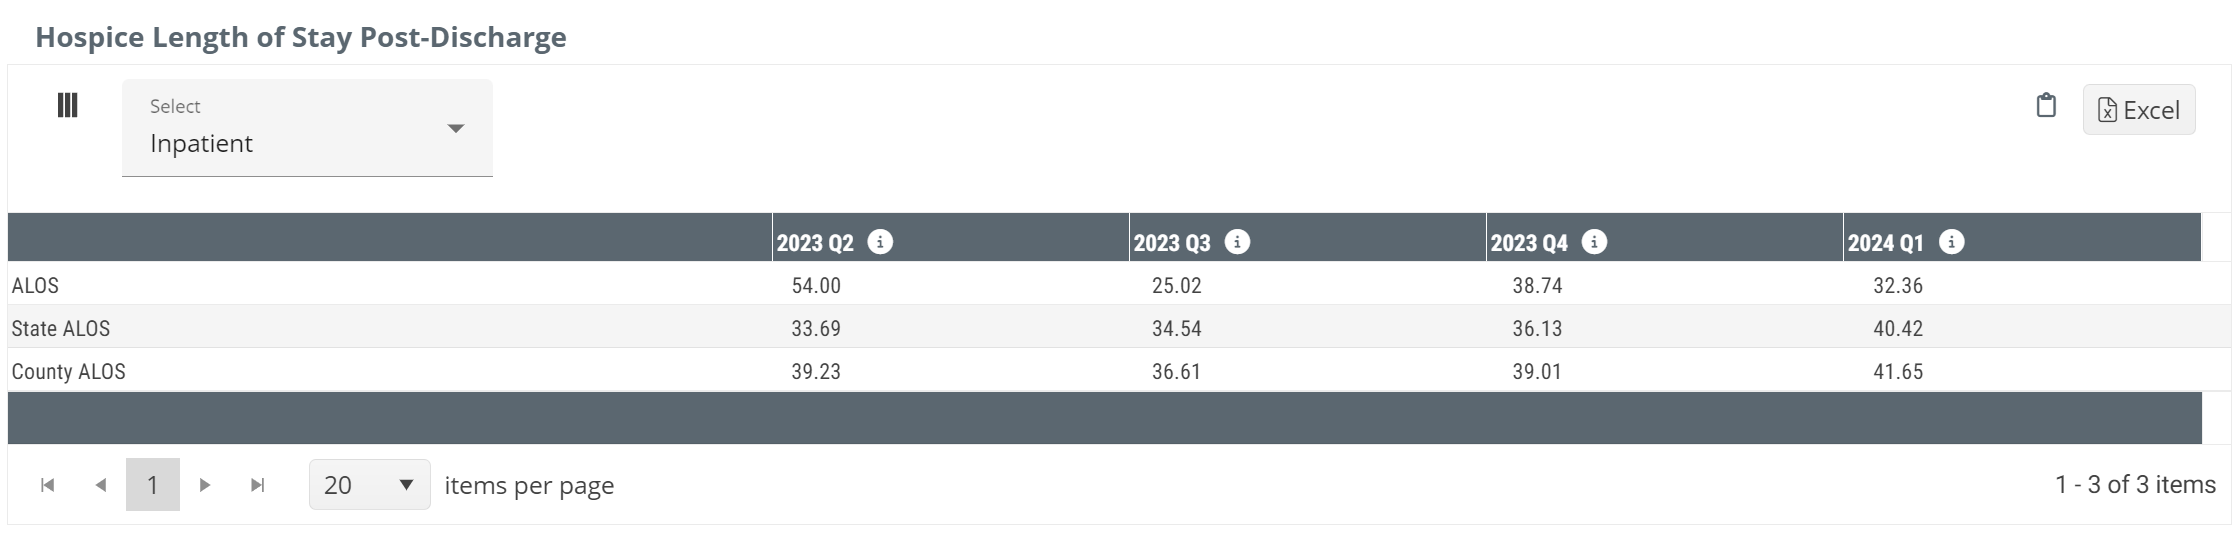
Facility Analyze page > Utilization and Quality tab > Hospice Length of Stay Post-Discharge table - ALOS This quarterly metric is the average number of days patients discharged from the selected facility spent in hospice, for patients discharged from hospice during the specified quarter and treated by the hospice within 30 days of discharge from the selected facility.
|
|
|
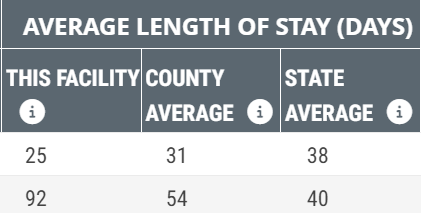
Facility Analyze page > Utilization and Quality tab > Patient Diagnostic Mix table - Average Length of Stay (Days) - This Facility For the selected facility - This metric is the average number of days per hospice stay, for patients who had a primary diagnosis code within the listed Trella diagnostic group and who received hospice care within 30 days of discharge from the selected facility. Includes only those hospice patients discharged during the one-year reporting period.
|
 |
|
Facility Analyze page > Utilization and Quality tab > Inpatient MS-DRG Breakout table - Average Length of Stay (Inpatient) The first metric is the average number of days spent in the selected facility for patients who had the MS-DRG listed on an inpatient claim and who were discharged during the one-year reporting period.
|
 |
|
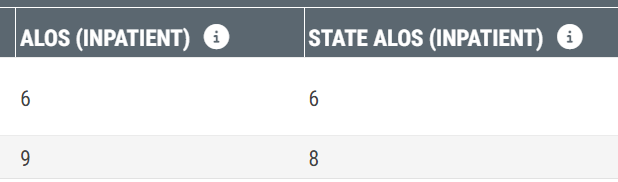
Facility Analyze page > Utilization and Quality tab > BPCI Groups table - ALOS (Inpatient) The first metric is the average number of days spent in the selected facility during the one-year reporting period for patients whose inpatient claim aligns with the listed BPCI group.
|
 |
|
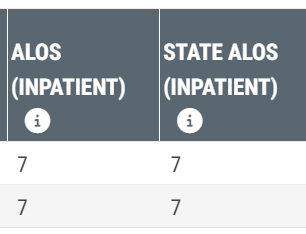
Facility Analyze page > Utilization and Quality tab > Readmission Groups table - ALOS (Inpatient) The first metric is the average number of days spent in the selected facility during the one-year reporting period for patients whose inpatient claim aligns with the listed Readmission Group.
|
 |
|
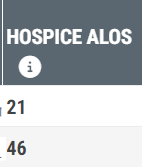
Facility Analyze page > Destinations tab > Hospice Destinations table - Hospice ALOS This metric is the average number of days spent at the listed hospice for patients discharged during the one-year reporting period who were discharged from the selected facility and admitted to the hospice within 30 days.
|
 |
|
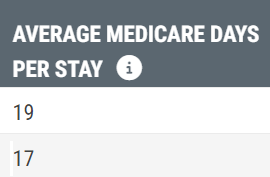
Facility Analyze page > Destinations tab > SNF Destinations table - Average Medicare Days per Stay This metric is the average number of Medicare-covered days spent in the listed SNF for patients discharged from SNF during the one-year reporting period who were discharged from the selected facility and admitted to the listed SNF within 30 days of facility discharge. |
 |
|
Hospice Analyze page > Quality and Operational tab > Trended LOS table This table includes ten different length of stay metrics pertaining to the selected hospice. Each row displays an annual metric and four quarters of trended metrics.
|
|
|
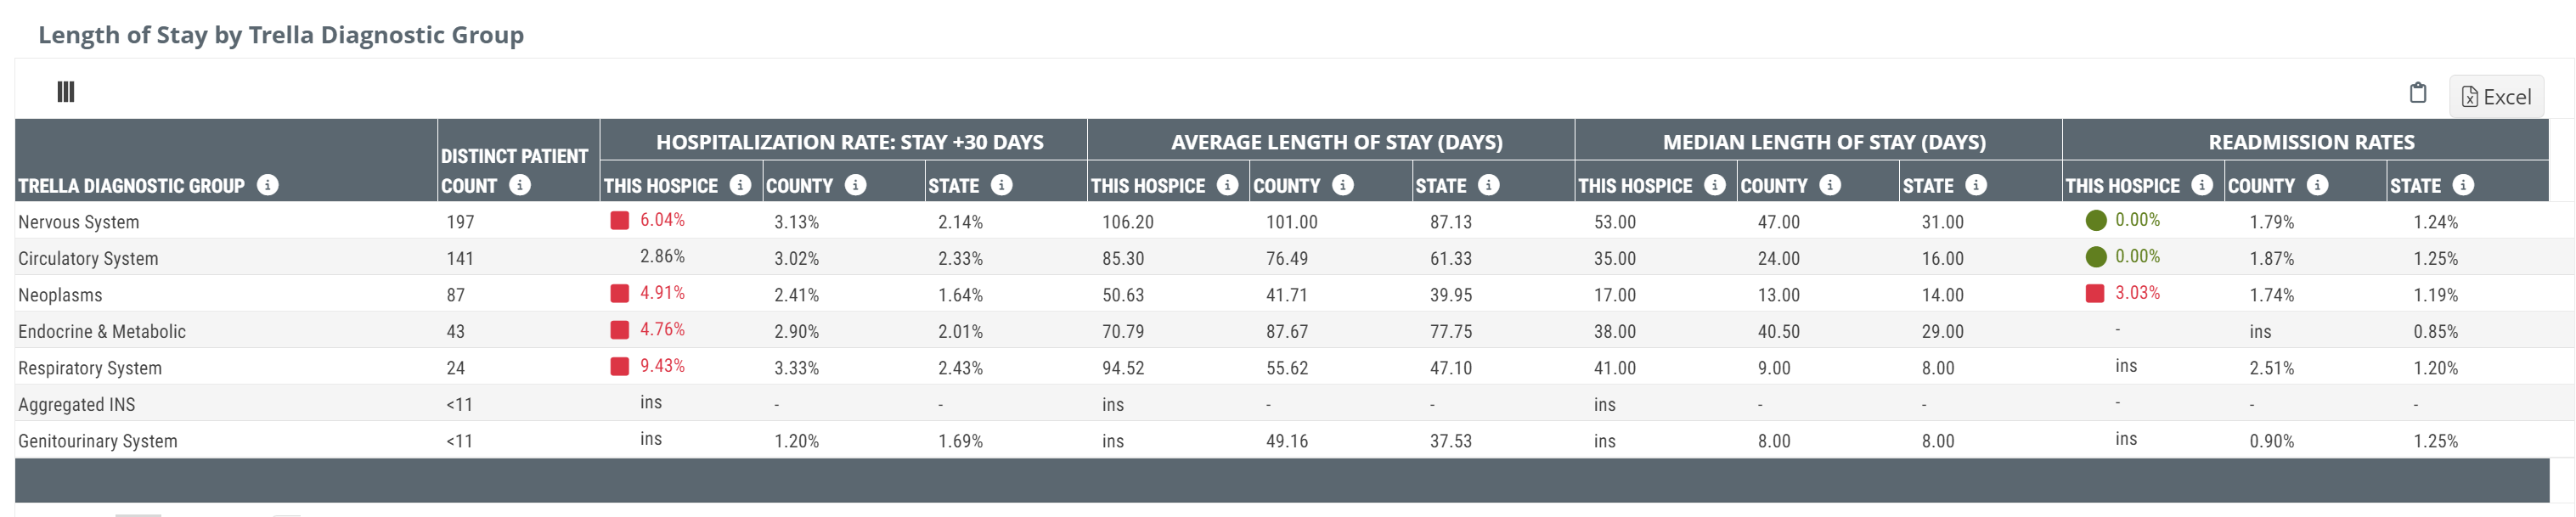
Hospice Analyze page > Quality and Operational tab > Length of Stay by Trella Diagnostic Group These metrics are the average (mean and median) number of days spent in hospice for patients discharged from the selected hospice during the one-year reporting period who had a diagnosis that aligns with the Trella Health diagnostic group listed in the row.
|
|
|
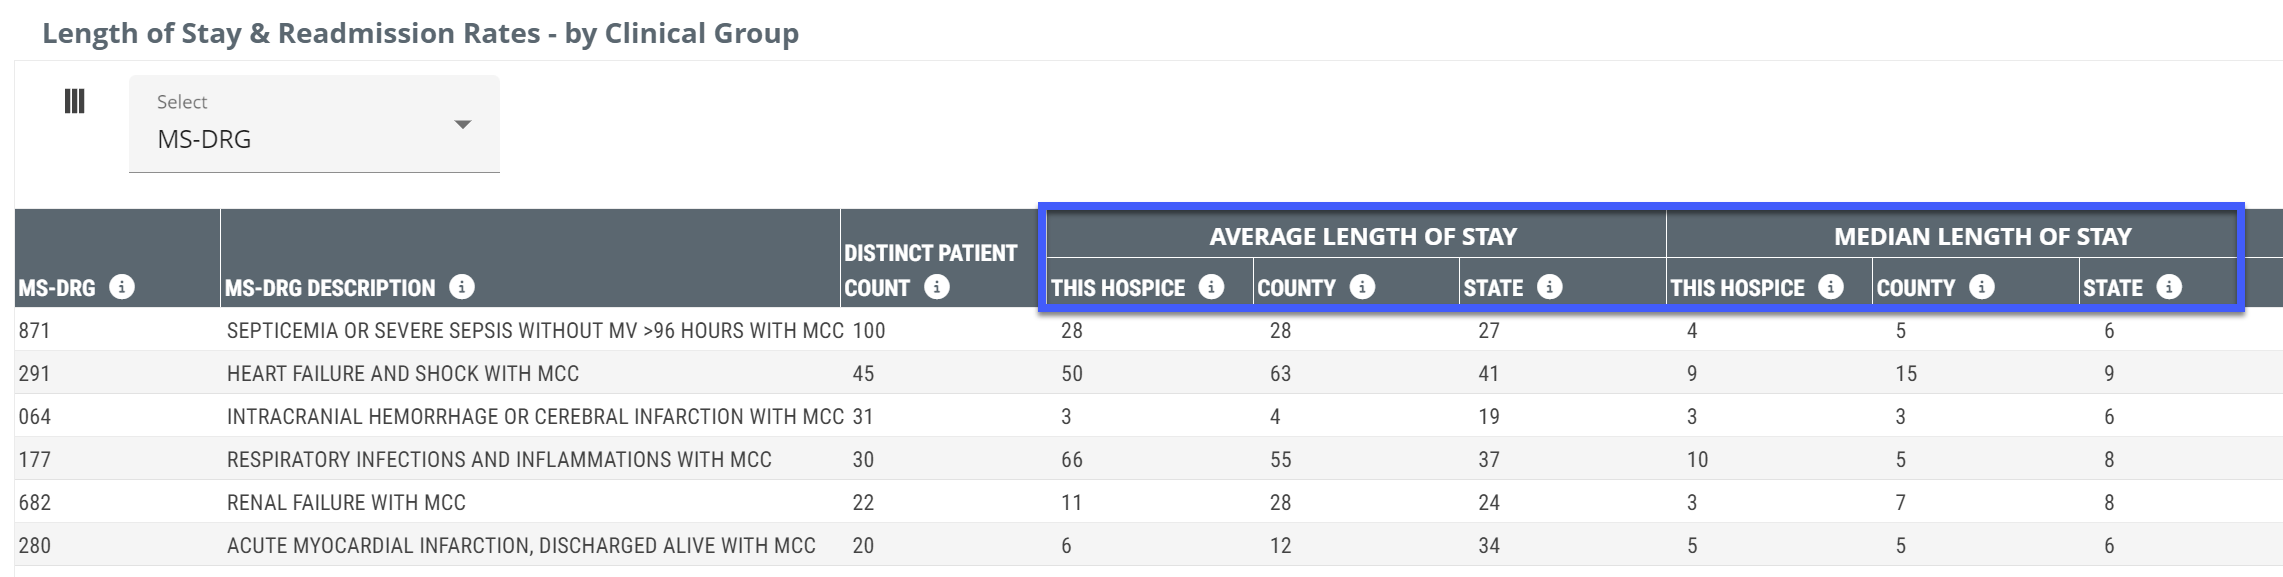
Hospice Analyze page > Quality and Operational tab > Length of Stay & Readmission Rates - by Clinical Group (MS-DRG, Readmission Group, or BPCI) The metrics in the table in the "This HOS" column are the average (mean and median) number of days spent in hospice for patients discharged from the selected hospice during the one-year reporting period who had a diagnosis that aligns with the MS-DRG, Readmission group of BPCI listed in the row.
|
Change clinical grouping with selector
|
|
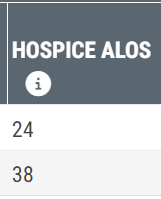
Hospice Analyze page > Sources tab > Facility Sources - Hospice ALOS This metric is the average number of days completed at the selected hospice for patients discharged from hospice care during the one-year reporting period who were discharged from the listed facility and admitted to the selected hospice within 30 days after discharge. |
 |
|
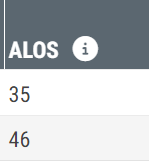
Hospice Analyze page > Sources tab > Physician Sources - ALOS This metric is the average number of days the physician's patients spent in the selected hospice, for patients discharged from hospice during the one-year reporting period and treated by the physician within 3 months prior to hospice admission
|
 |
 to the left of a row to open a definition for the length of stay in that row.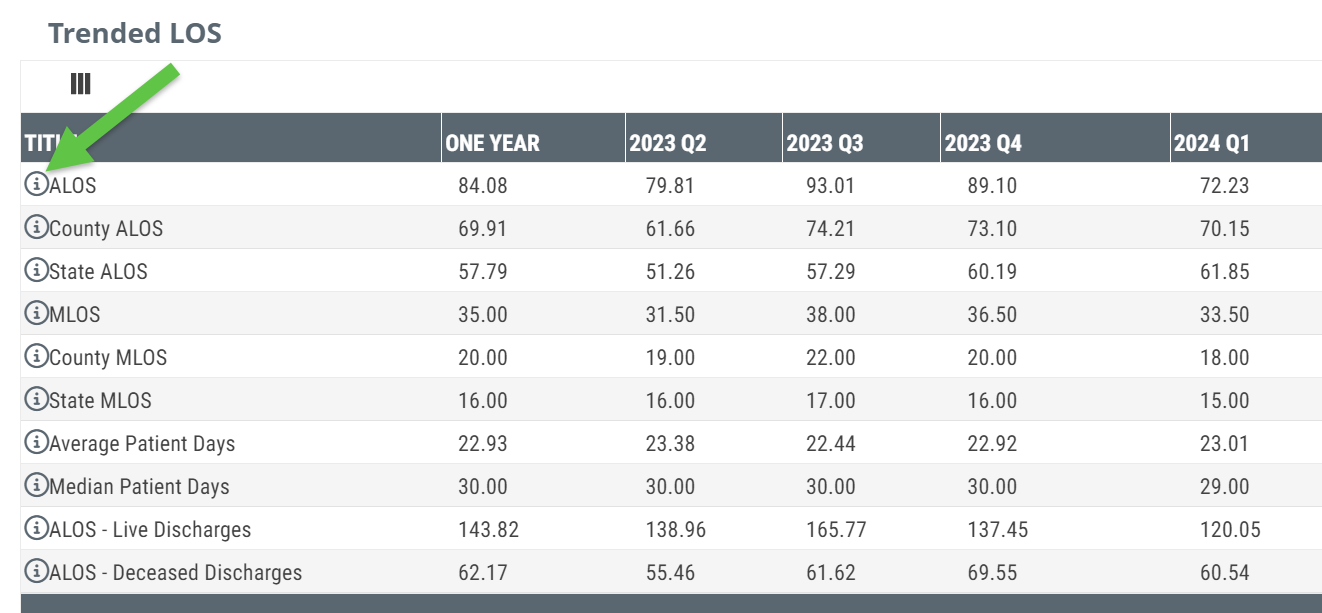
Home Health |
|
Location - Details |
Image |
|
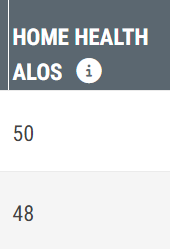
Physicians Explore page - Home Health ALOS This metric is the average number of days spent in home health care for patients discharged during the one-year reporting period who were treated by the physician within three months prior to the home health admission. |
 |
|
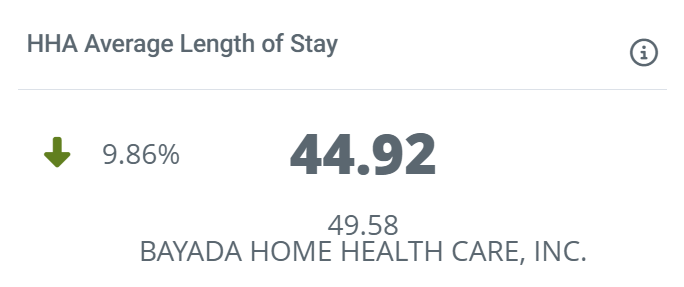
Facility Analyze page > Sales Spotlight tab > How Do I Stand Out? section > HHA Average Length of Stay tile This metric is the average number of days spent in the selected "My Agency" that provided home health care for patients discharged during the one-year reporting period who were previously discharged from the selected facility within 30 days of admission to home care.
|
 |
|
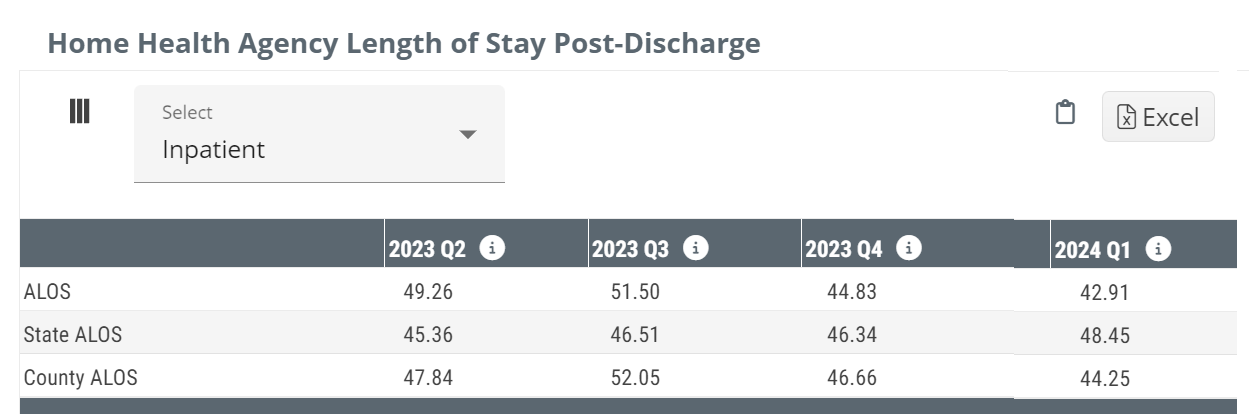
Facility Analyze page > Utilization & Quality tab > Home Health Agency Length of Stay Post-Discharge table - trended ALOS These metrics are the average number of days patients spent in home health services, for patients discharged from home health during the specified quarter and treated by the HHA within 30 days of discharge from the selected facility
|
|
|
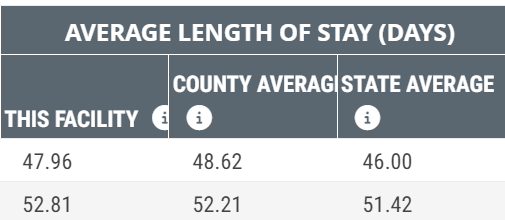
Facility Analyze page > Utilization and Quality tab > Patient Diagnostic Mix table - Average Length of Stay (Days) For the selected facility - This metric is the average number of days per home health stay, for patients who had a primary diagnosis code within the listed Trella diagnostic group and who received home health care within 30 days of discharge from the selected facility. Includes only those home health patients discharged during the one-year reporting period.
|
 |
|
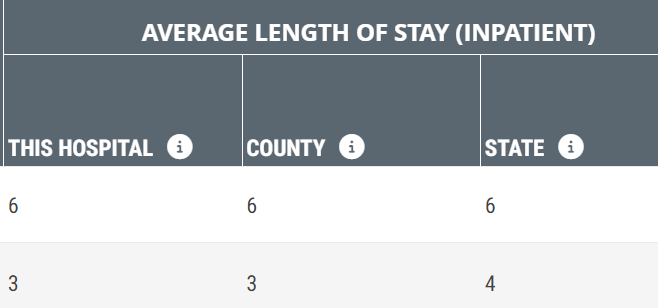
Facility Analyze page > Utilization and Quality tab > Inpatient MS-DRG Breakout table - Average Length of Stay (Inpatient) The first metric is the average number of days per home health stay spent in the selected facility for patients who had the MS-DRG listed on an inpatient claim during the one-year reporting period.
|
 |
|
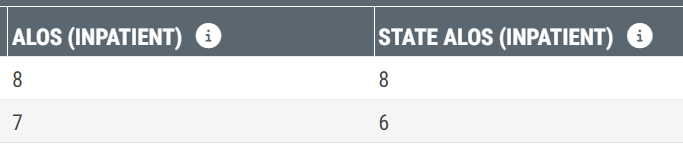
Facility Analyze page > Utilization and Quality tab > BPCI table - ALOS (Inpatient) The first metric is the average number of days per home health stay spent in the selected facility during the one-year reporting period for patients whose inpatient claim aligns with the listed BPCI group.
|
 |
|
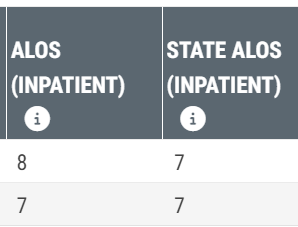
Facility Analyze page > Utilization and Quality tab > Readmission Groups - ALOS (Inpatient) The first metric is the average number of days per stay spent in the selected facility during the one-year reporting period for patients whose inpatient claim aligns with the listed Readmission group.
|
 |
|
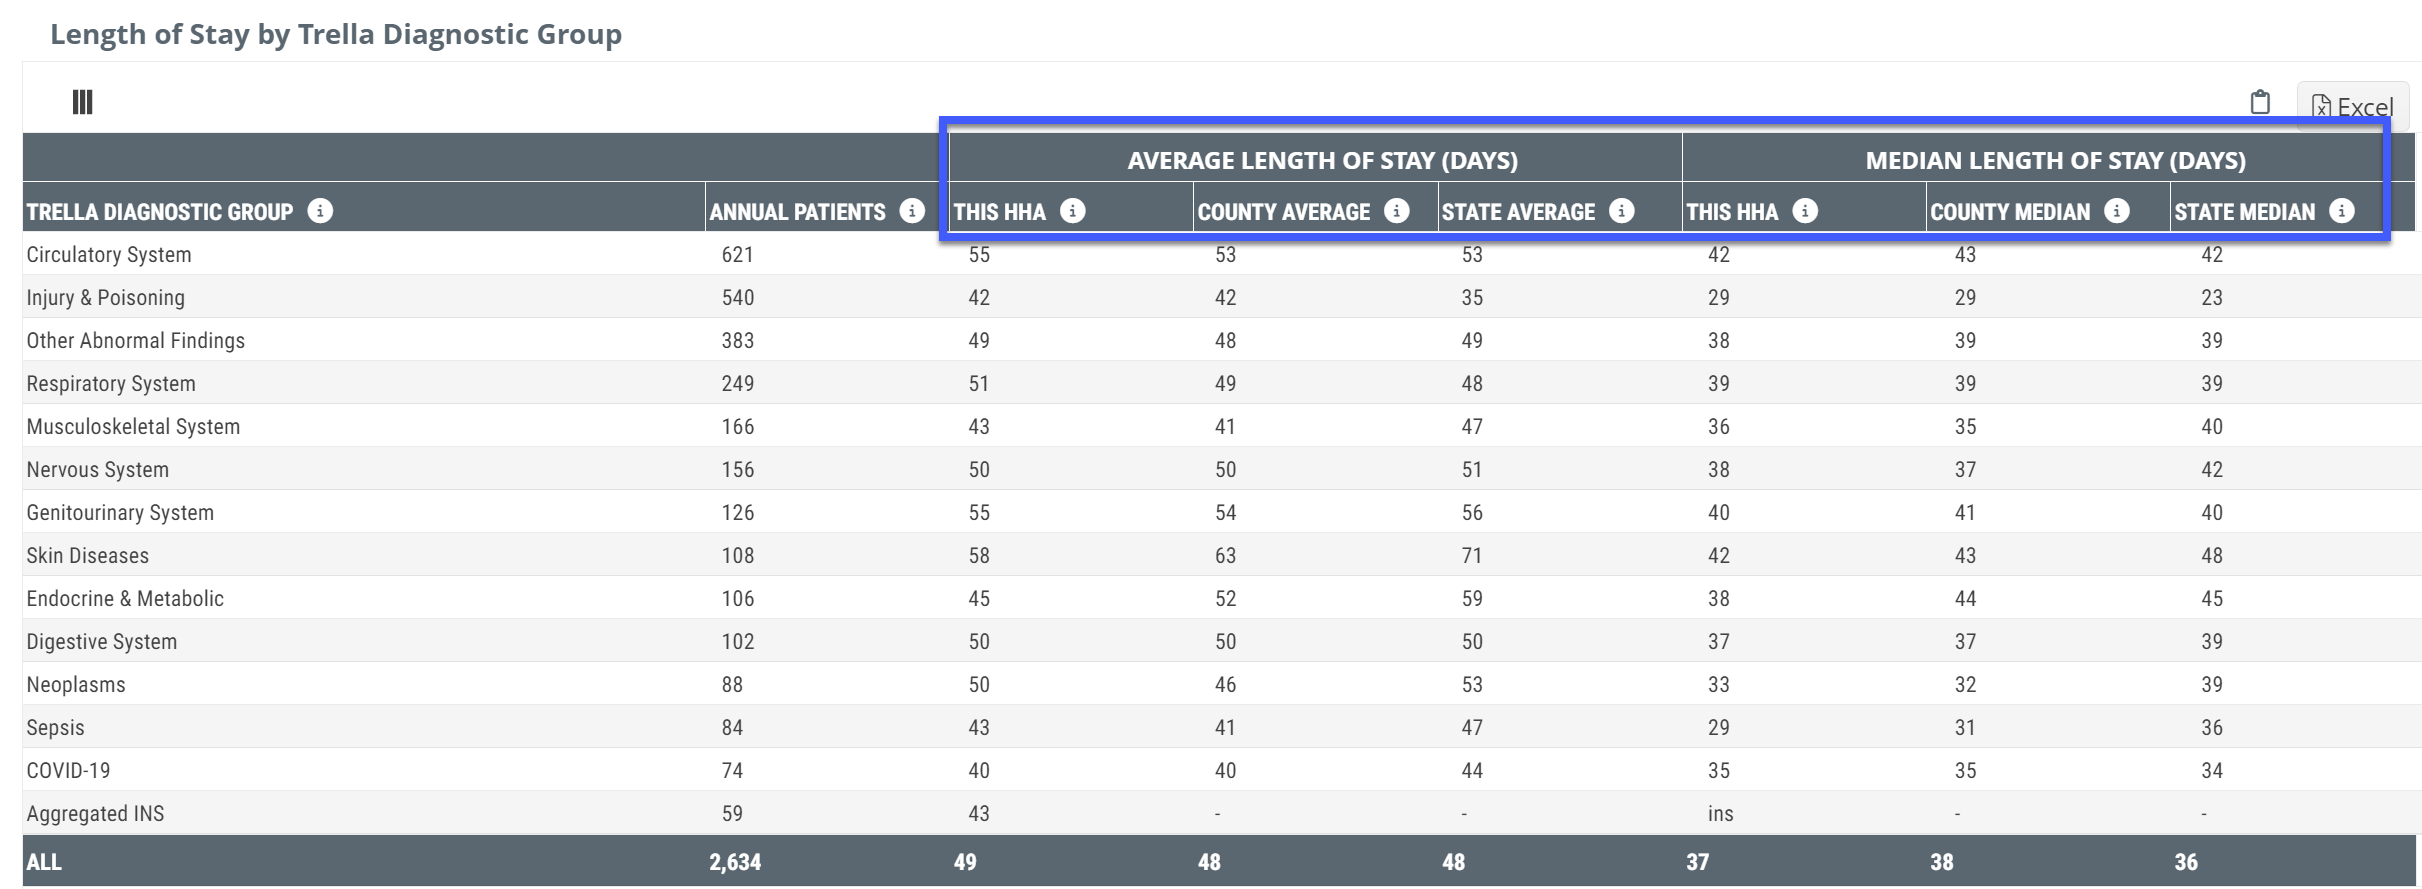
Home Health Analyze page > Quality tab > Length of Stay by Trella Diagnostic Group These metrics are the average (mean and median) number of days spent in home health for patients discharged from the selected home health agency during the one-year reporting period who had a diagnosis that aligns with the Trella Health diagnostic group listed in the row.
|
|
|
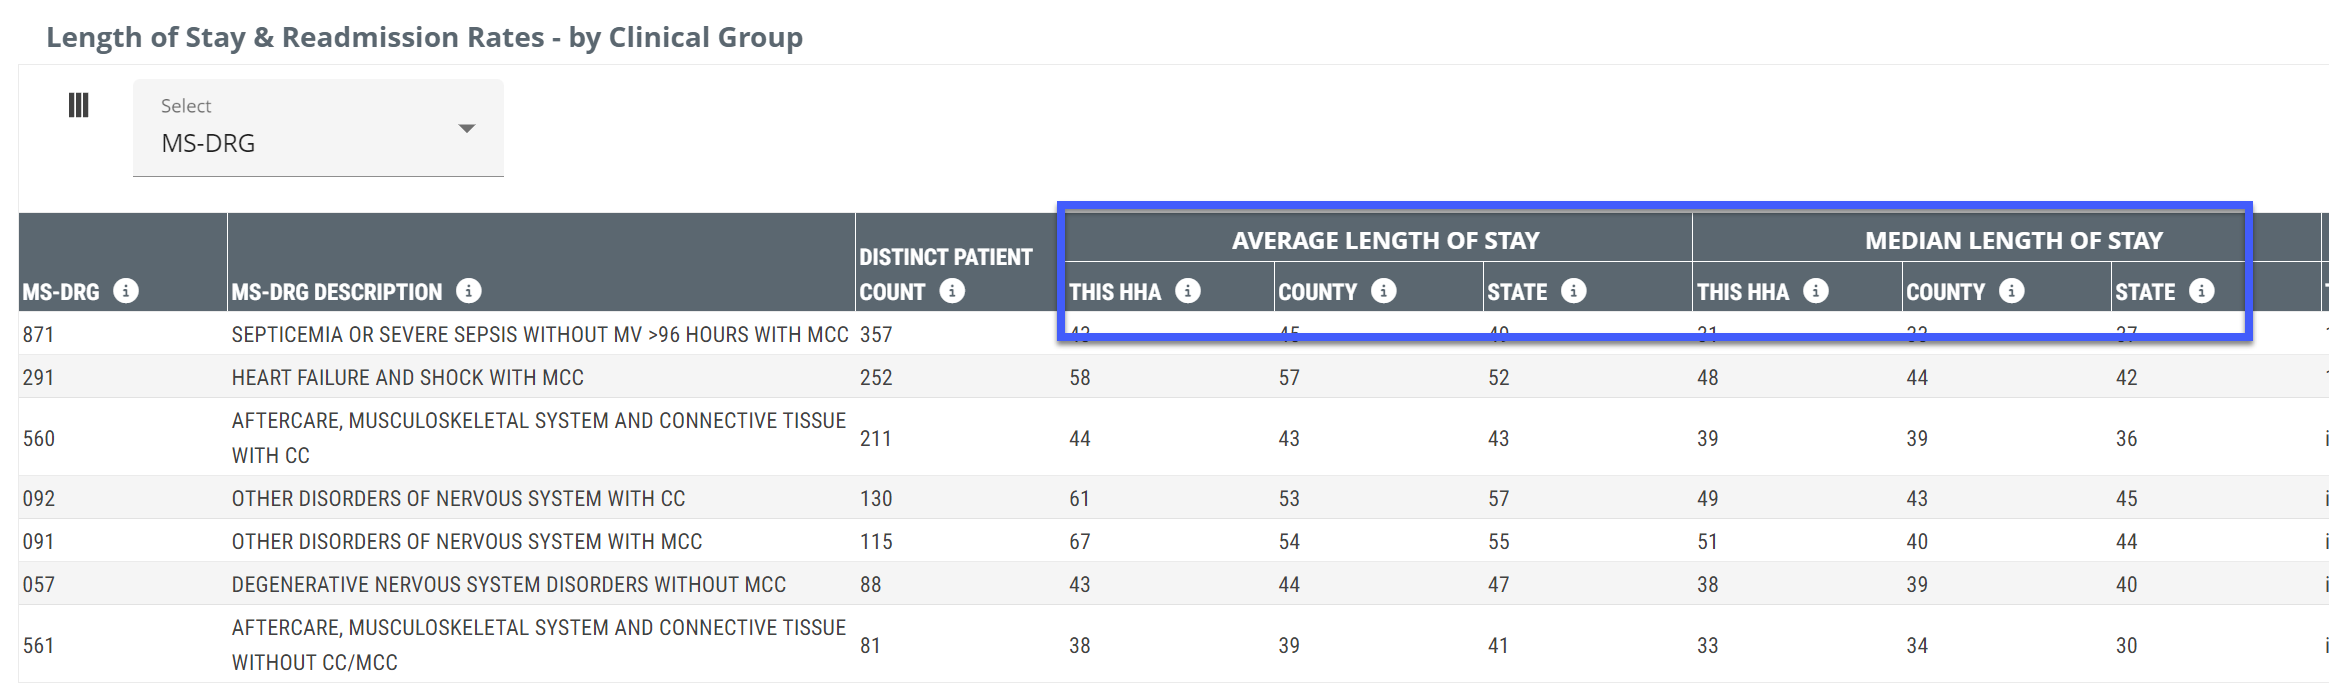
Home Health Analyze page > Quality tab > Length of Stay & Readmission Rates - by Clinical Group (MS-DRG, Readmission Group, or BPCI) The metrics in the table in the "This HHA" column are the average (mean and median) number of days spent in home health for patients discharged from the selected home health agency during the one-year reporting period who had a diagnosis that aligns with the MS-DRG, Readmission group of BPCI listed in the row.
|
Change clinical grouping with selector
|
|
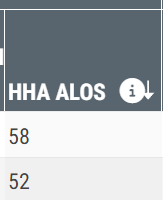
Home Health Analyze page > Sources tab > FFS Facility Sources - This HHA - HHA ALOS This metric is the average number of days per stay for home health patients discharged from the selected home health agency during the one-year reporting period who were discharged from the listed facility and admitted to the HHA within 30 days after facility discharge |
 |
|
Home Health Analyze page > Sources tab > FFS Physician Sources - ALOS This metric is the average number of days the physician's patients spent in this HHA, for patients discharged from HHA during the one-year reporting period and treated by the physician within 3 months prior to HHA admission |
 |